
This summer, Stamen and The Gray Area Foundation for the Arts hosted six fellowship projects. This was the second year of the Creative Code fellowships, and the fellows came from all over the United States to work on data visualization projects about the Bay Area. They were put into crash courses in visualization and hardware technology at Gray Area, and had desks in the Stamen studio, joining us for critiques and lunch, and adding great energy to the office. The summer ended with a group show at Gray Area, with a packed house and presentations from the artists.
We are also very fortunate to have a Data Partners from the Bay Area that stocks the Fellows with datasets, local context for their work, critical feedback, and access to their best and brightest. We would like to sincerely thank these partners for their time and data: SPUR, Exploratorium, The University of Berkeley College of Environmental Design, Presence PG, Obscura Digital, and Britelite Immersive.
We had a fantastic group of Fellows, and it was great to see these projects take shape during the summer. Here’s an overview of the fellows and their work:
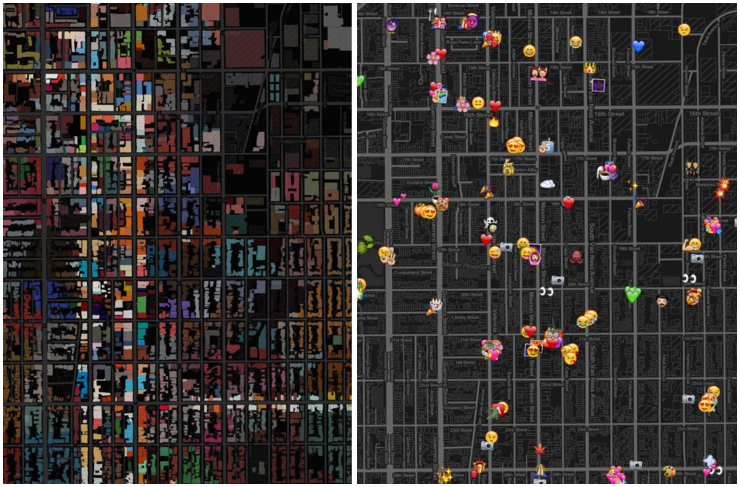
Steve found ways to collect and displays real-time data from and about the Mission District in San Francisco, including weather, social media words, emoji use, instagram colors, public transportation, and real estate stats. His experiments in visualization worked on temporal, social, and civic aspects of the neighborhood. Urban Heartbeat collected these experiments into a street installation that invites exploration of real-time, generative data visualizations. The visualizations were placed as live screens on Mission Street, engaging passers-by with data from the neighborhood.
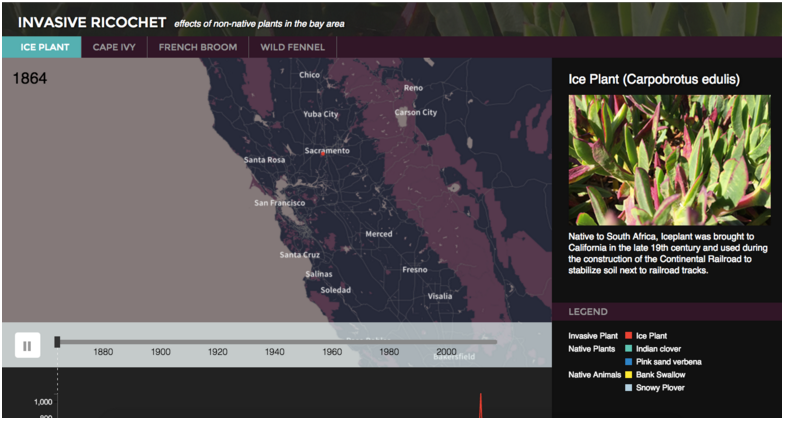
Following a series of personal projects about urban plant life, Jill examined the invasive plant species in California, and the effects they had on local ecosystems (the impact to both native plants and other wildlife communities). She used species observation data gathered over the last 100 years to map the spread of invasives through time and space. Related historical moments and cultural anecdotes related to these plants were connected to the visualization to flesh out the story of their role and consequences to California.
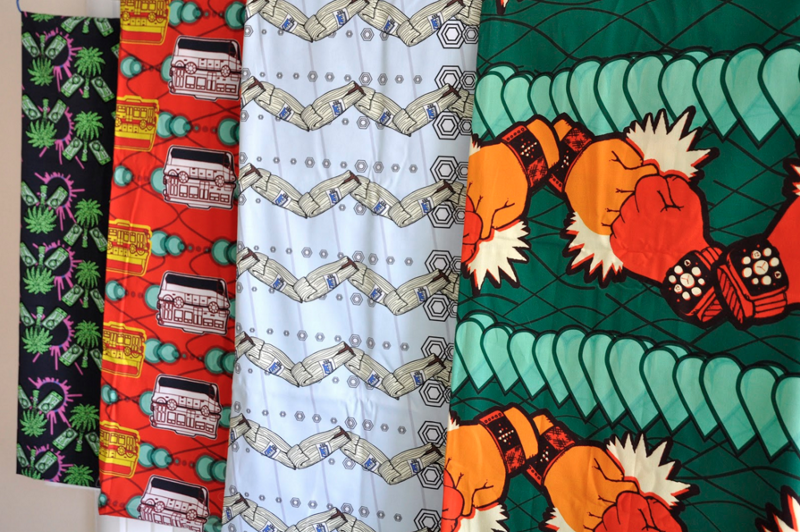
Coming out of trips to Senegal and Mali, Andrew became inspired by Dutch Wax Block Print Fabrics, which are ubiquitous to much of West Africa, and often incorporate everyday objects such as: computers, cell phones, binoculars, and USB cables. For the fellowship, Andrew created a series of San Francisco Block Print Fabrics, combining data and objects specific to this time and space in the Bay Area. Using Processing and csv data, the images and data can be swapped out, resized, recolored, combined, rotated, spaced, and more using parametric software sliders, toggle switches, knobs, and keyboard input. These patterns were then digitally printed to be turned into clothing and other textiles.
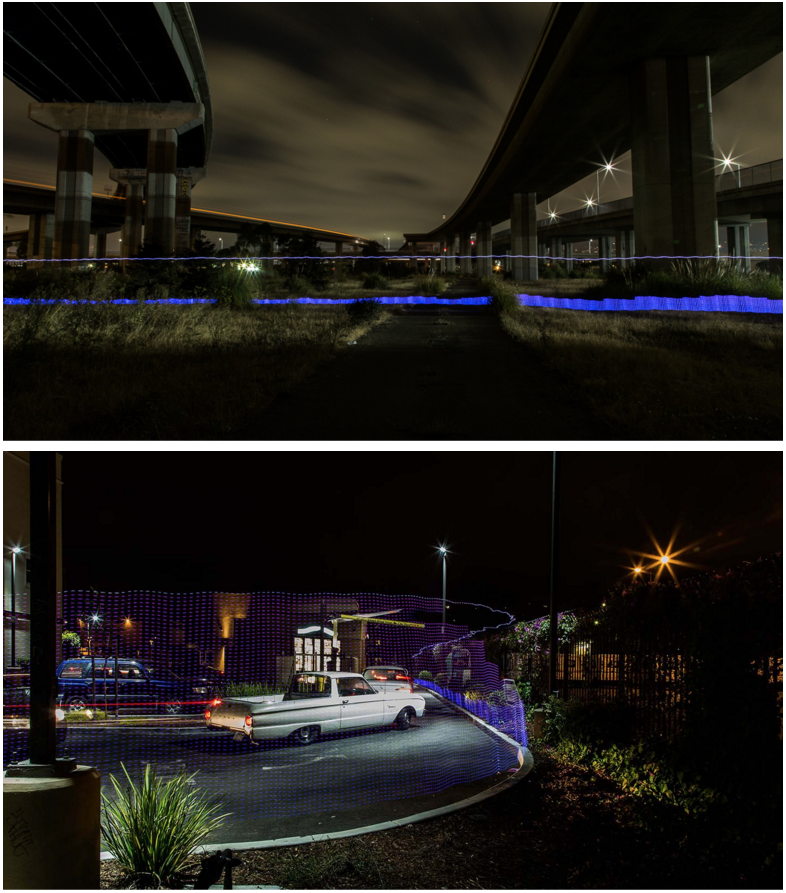
Joe and Elaine investigated ways of collecting and visualizing localized changes in air quality due to small proximity changes — highways, parking lots, parks. They set up a air sensor system that could test fluctuations and show levels with LED light displays. They then started photographing these LED levels with long exposure photography to see air quality at a particular time and space, and literally in the landscape it came from. This type of hyper-localized, physical data visualization in the end appear encapsulated in these images.
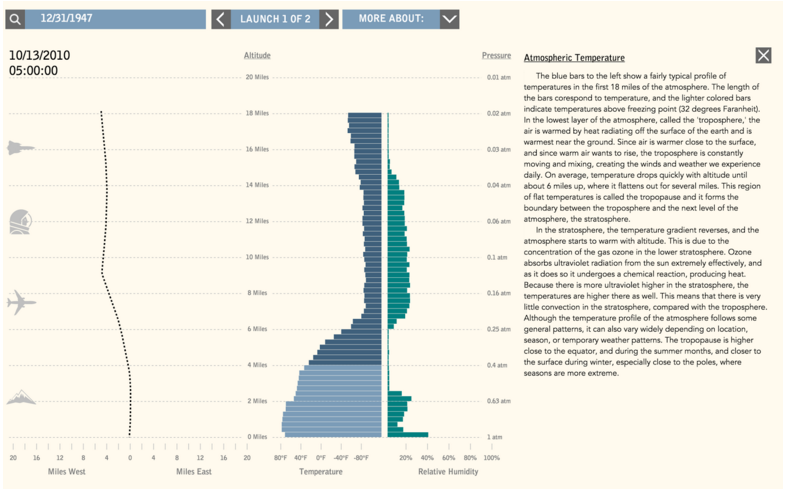
Carlo set of in search of a way to visualize and understand vertical oriented weather data in the Bay Area. In search of data, he started working with the Integrated Global Radiosonde Archive and weather balloons data from the Oakland Airport. Oakland Atmospheres works to reconcile this 70 years of data, and create a display that can access this data and engage users with vertical oriented weather data.
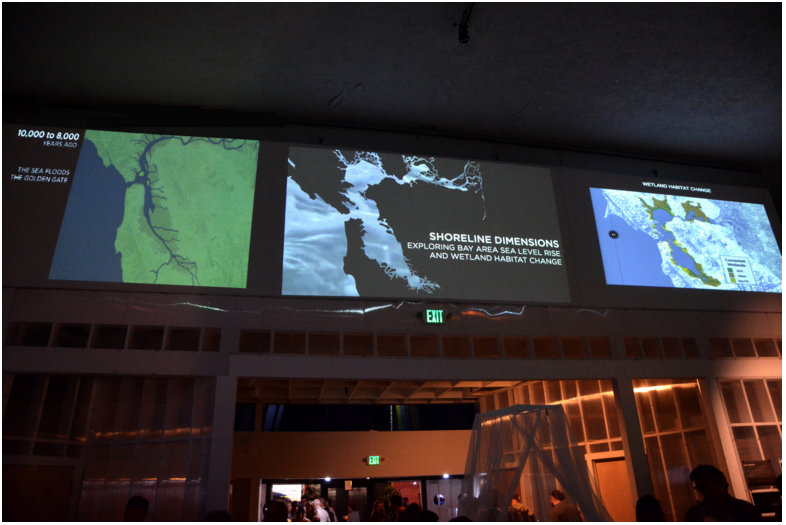
Lindsay investigated the changing water’s edge in the Bay Area through geologic time. Mashing up past and future projections of where land and water converge, she created a timeline of the last 18,000 years of the Bay Area, and the projected next 100 years, showing the constantly changing condition between water and land in San Francisco.
We will have more information soon about our 2016 Fellows, and how to apply. The fellowships have grown a lot even in the last two years, and we are excited about the direction it is taking for the next year. If you are interested in helping to support this program, as a partner or funder, please get in touch with us, and help us grow this great program!