
We’re excited to announce Big Glass Microphone, a collaboration between Stamen Design and the Victoria and Albert Museum.
Yesssssssss!
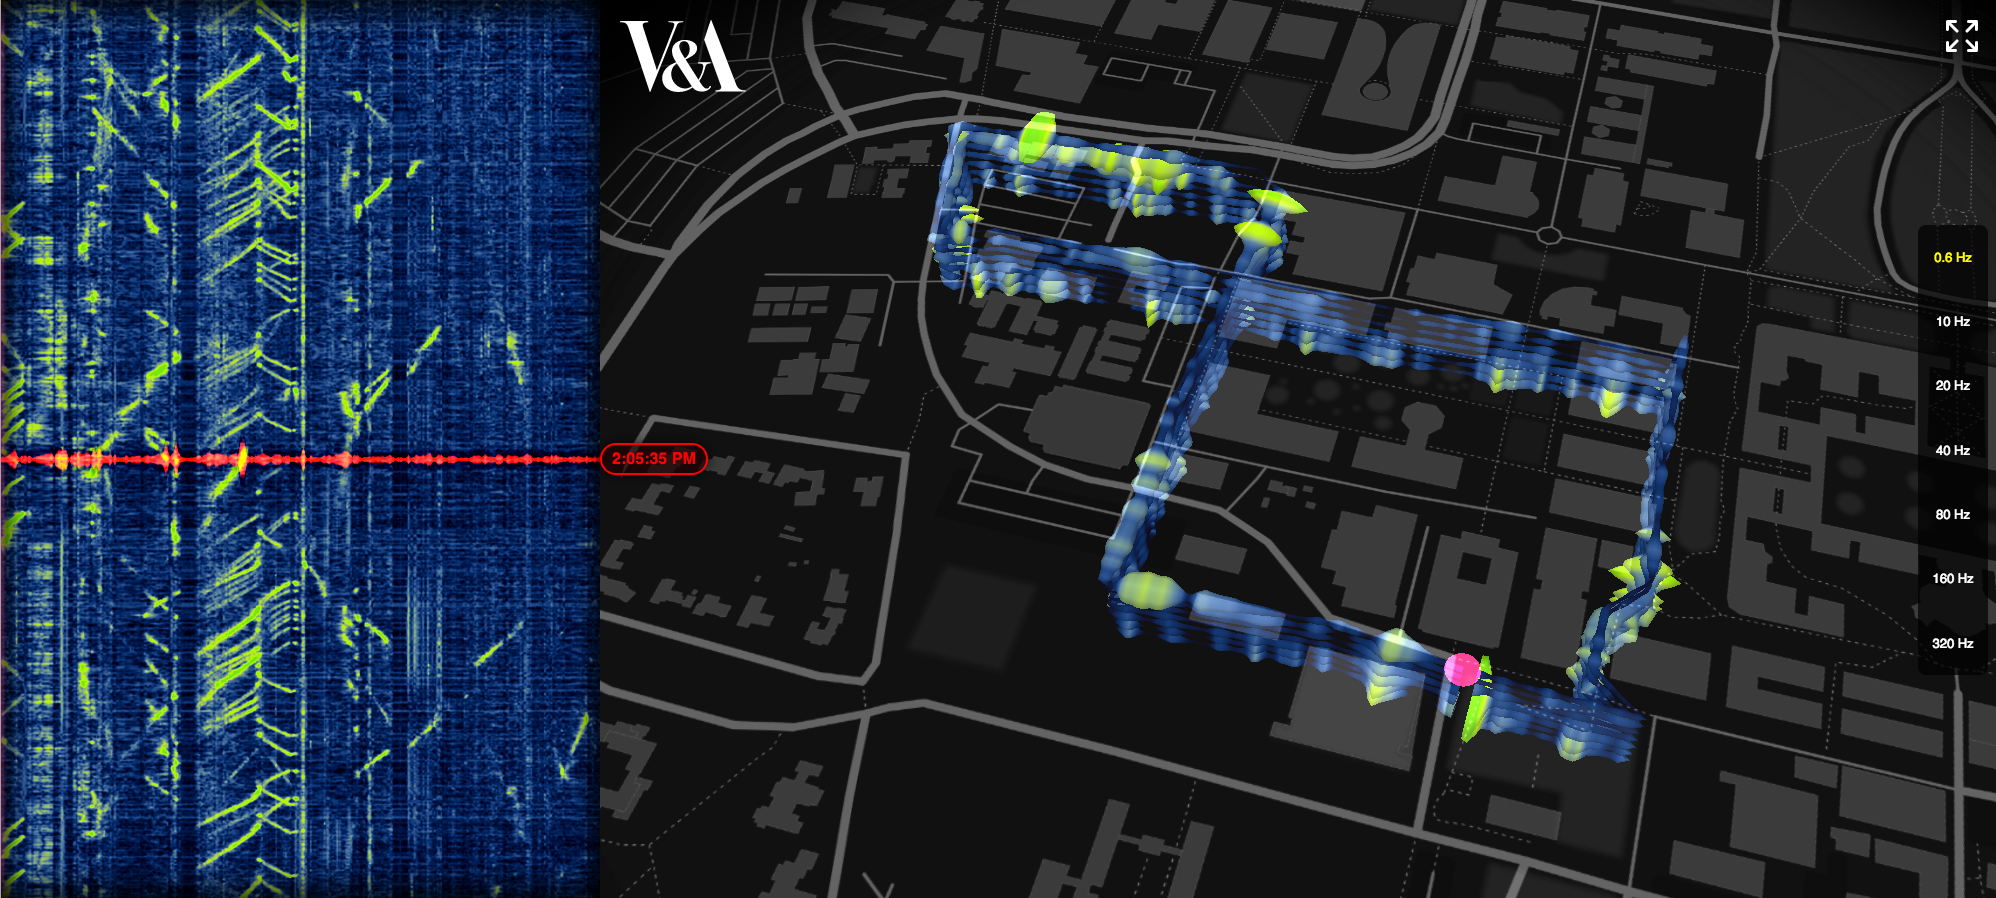
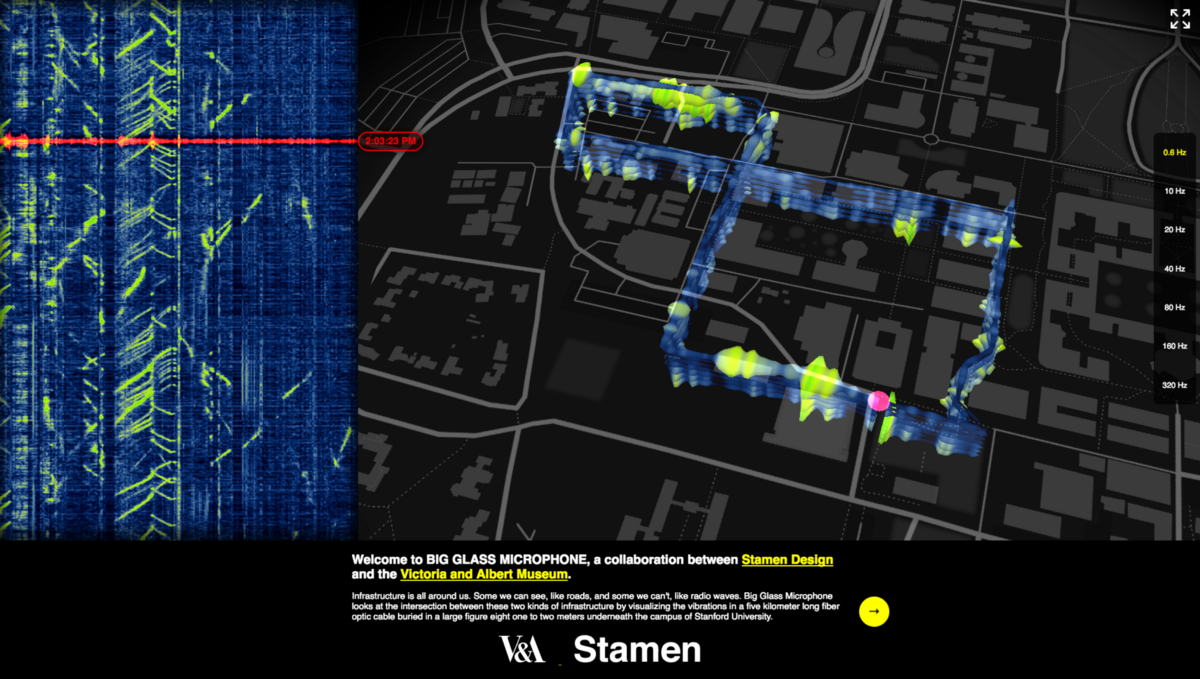
Infrastructure is all around us. Some we can see, like roads, and some we can’t, like radio waves. Big Glass Microphone looks at the intersection between these two kinds of infrastructure by visualizing the vibrations in a five kilometer long fiber optic cable buried underneath the campus of Stanford University. The cable is mostly used for analyzing seismic waves as they pass through campus; we’re using it to look closer at activities closer to home.
5 mile long fiber optic cables are pretty cool
Fiber optic cables are usually used for sending signals from one place to another. The vibrations that nearby moving objects cause in the cables are usually considered undesirable and filtered out as noise. But by turning the noise into signal, we can make inferences about things that are near that cable. The map above shows the location of the cable on the Stanford Campus in a giant figure-eight loop buried under the ground. Using Distributed Acoustic Sensing technology from Optasense, a company that installs this technology along railroads, pielines, and other infrastructure, Big Glass Mic visualizes the distinct shapes that different kinds of events have on this fascinating incidental listening device.
A wide spectrum of vibrations can be detected and analyzed
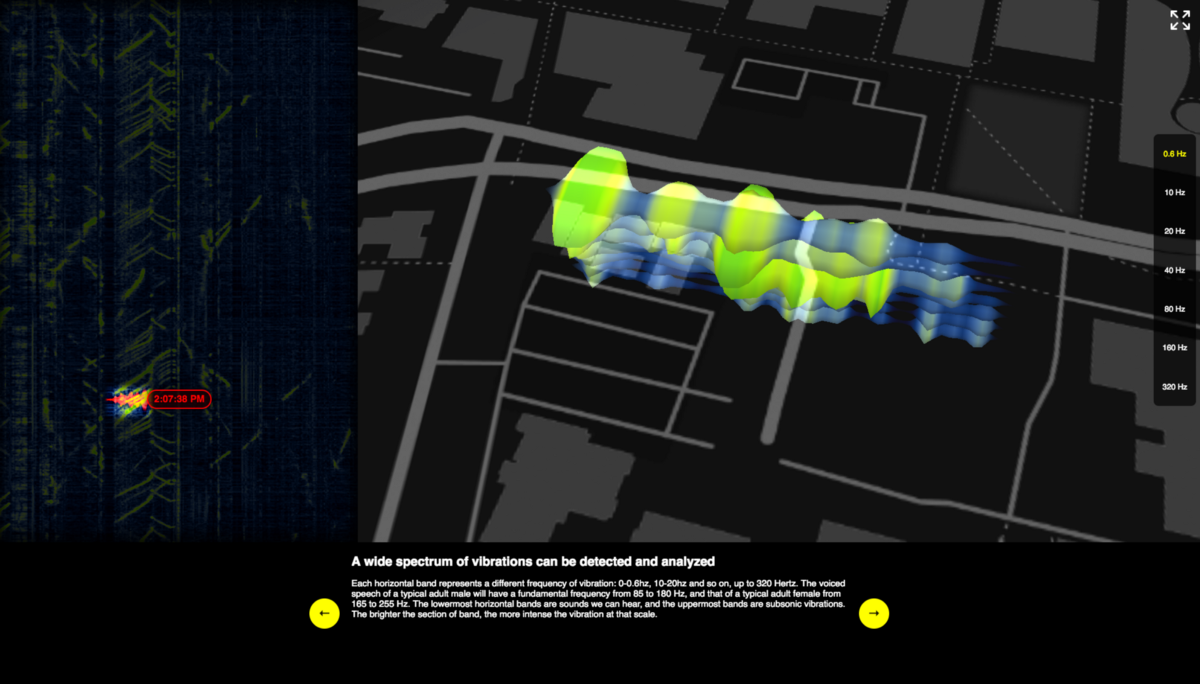
Each horizontal band represents a different frequency of vibration: 0–0.6hz, 10–20hz and so on, up to 320 Hertz. The voiced speech of a typical adult male will have a fundamental frequency from 85 to 180 Hz, and that of a typical adult female from 165 to 255 Hz. The lowermost horizontal bands are sounds we can hear, and the uppermost bands are subsonic vibrations. The brighter the section of band, the more intense the vibration at that scale.
Individual segments of the cable
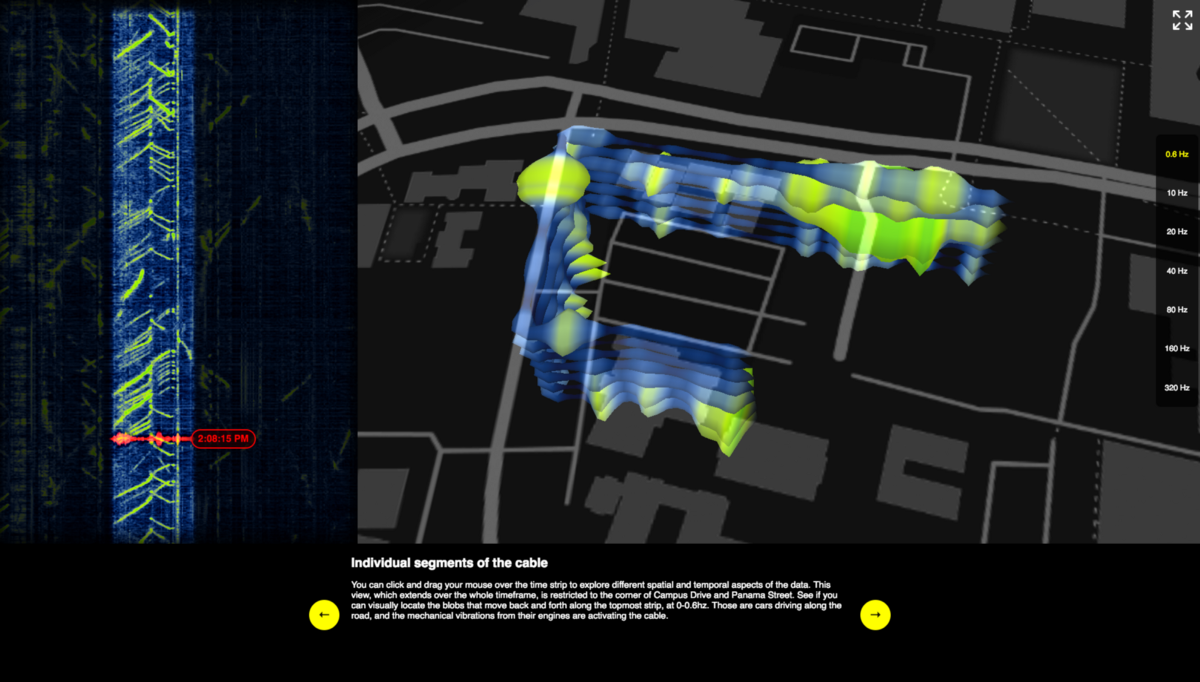
You can click and drag your mouse over the time strip to explore different spatial and temporal aspects of the data. This view, which extends over the whole timeframe, is restricted to the corner of Campus Drive and Panama Street. See if you can visually locate the blobs that move back and forth along the topmost strip, at 0–0.6hz. Those are cars driving along the road, and the electromagnetic impulses from their engines are activating the cable.
You can look at specific time windows, too
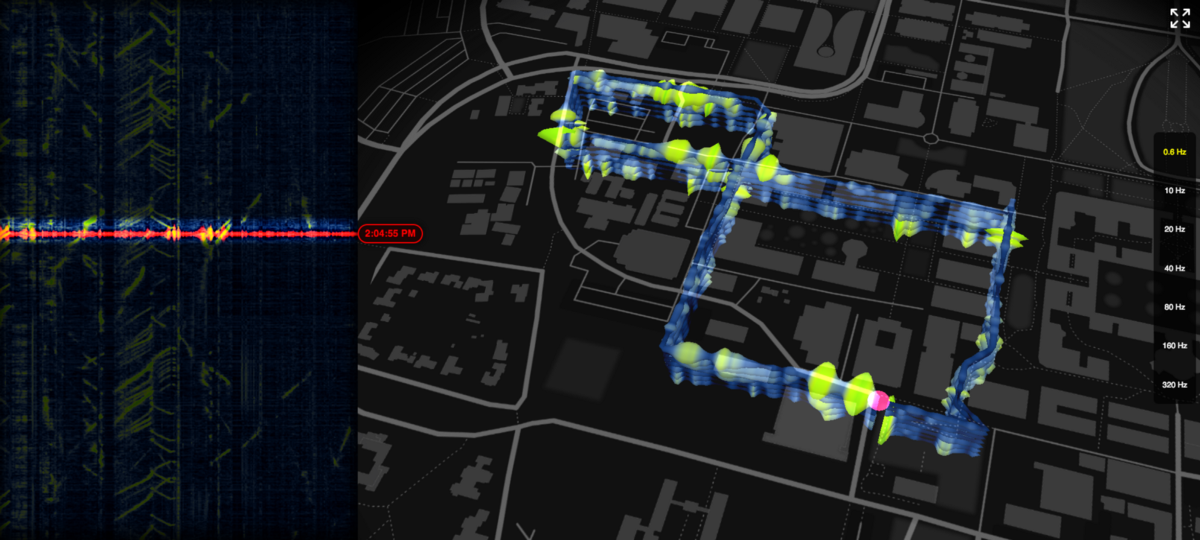
The same interface can be used to restrict the length of time that’s being shown on the map. Here we see the whole loop for about ten seconds of time, from 2:04:47–2:04.57. There’s clear movement of cars in that timeframe across multiple spectra.
Other moving things look different to the cable
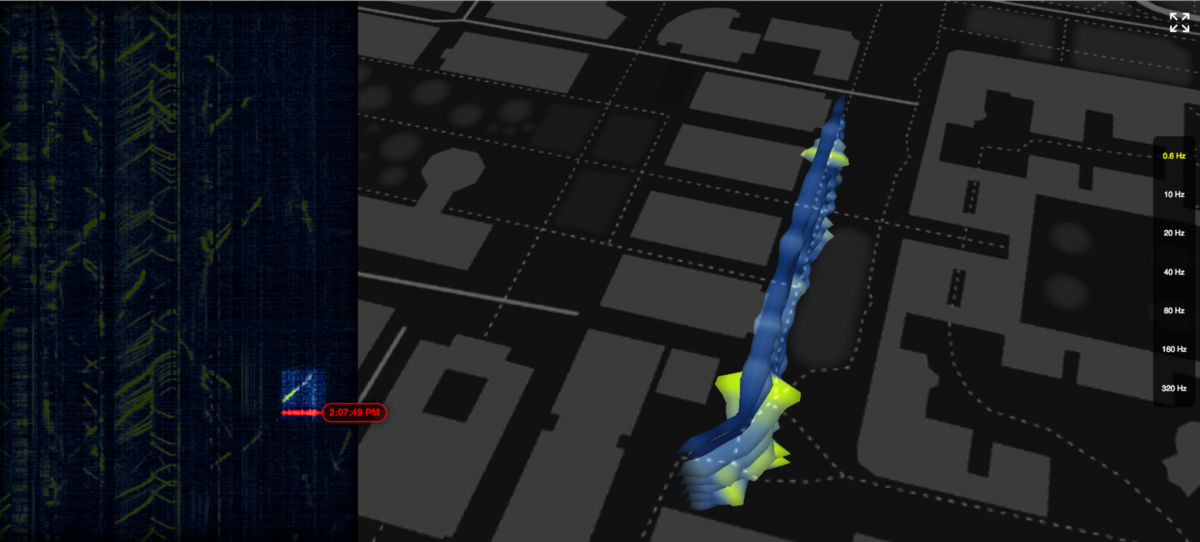
It seems to be a characteristic of cars that they activate multiple levels of the frequency detection. This ten-second clip, located along one of the many footpaths on campus, shows a much less activating kind of movement; since it’s along a footpath we think it might be a person or a bicycle.
Some kinds of things stay put
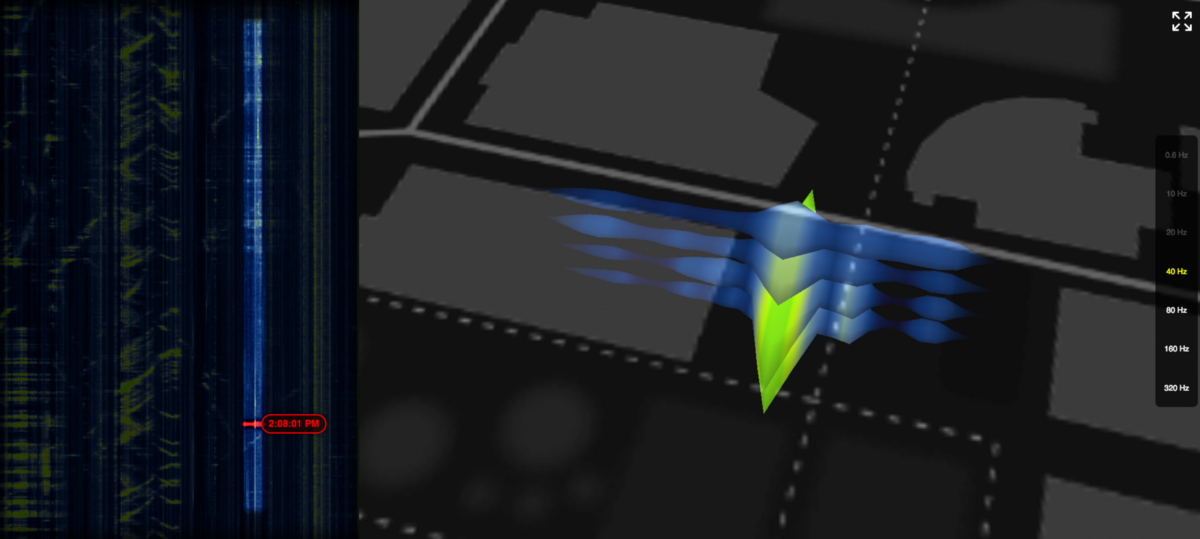
Vertical lines in the time chart are good places to look for interesting features. They denote a feature that’s staying in one place, but continuously making vibrations at or about the same rate. This vertical line marks the position of a fountain at Leland Stanford Jr University, which (when it’s on) sends out a more or less constant vibration of between 160–300hz, a bit higher than a human voice.
Stay a while!
Big Glass Microphone is intended to evoke a sense of wonder about the kinds of detections and interactions that are increasingly common in our uniquitously networked society. If a fiber optic cable buried in the ground can tell that you’re walking by, what can the telephone wires over your head tell? What kinds of artistic, urban, commercial, governmental possibilities await as more and more cable is laid to power, say, smart street lights? We hope you’ll explore the project and that it gives you a sense of where all this sensing and detection is headed. If you’re interested in finding out more about the project, please get in touch, or let us know what you think on Twitter or Facebook.
Special thanks to Martin Karrenbach and John Williams at Optasense and Eileen Martin at Stanford, the Stanford Exploration Project and Stanford’s School of Earth, Energy & Environmental Sciences for their contributions to this project. We’re delighted that our friend Ryan Alexander led the development effort.