
This is an abridged version of a talk I gave at the amazing Teatro Petruzelli for TEDx Bari: Disorder on November 19, 2017. All errors are my own.
A bundle of digital technologies is reshaping our lives and how we make all kinds of transactions. It’s also reshaping the built environment, as access to digital technology unmakes our assumptions about planning and transit and communications (Uber and Lyft, for example, have my decision to place both my work and home locations close to public transit and taxis not nearly as compelling as it used to be). This reshaping is happening in many different ways, across many different landscapes. Increasingly it is being done by intelligent machines with artificial intelligence; effectively robots.
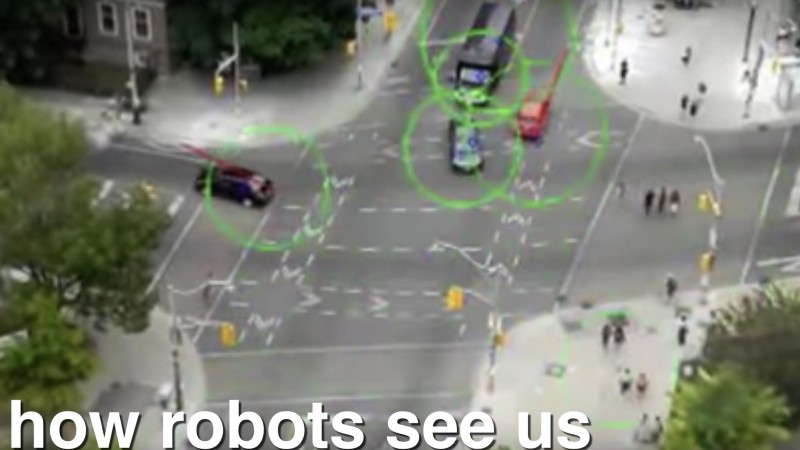
Robots see differently than people. They see order and disorder much differently than we do. Some of this is worrying. Some of this is fascinating. We should talk about it more, and think about it with our eyes as well as our brains. It’s one thing to describe this in words, it’s another to see it. So these are pictures about robots and how they think.
What follows is new work in progress we’re doing with Aman Tiwari at Carnegie Mellon University, sponsored by Jordan Winkler at Digital Globe. It’s about robots reading satellite imagery and demographic information. I’m just learning about and learning how to talk about these, so I don’t have a lot of concrete conclusions to draw (yet), but it’s new and strange enough that I want to do this in public and learn from what other people think and how they respond.
The times they are a-changin’
The project is about rapid and dramatic changes in how we think about order and disorder, due to the arrival of machine learning and artificial intelligence. In the last very few years there’s starting to be a mainstream conversation about these robots and how they work. People are waking up to the idea that when they’re interacting with things like Facebook and Twitter and Instagram, they’re not so much interacting with other people as they are interacting with an artificial intelligence; a very smart robot.
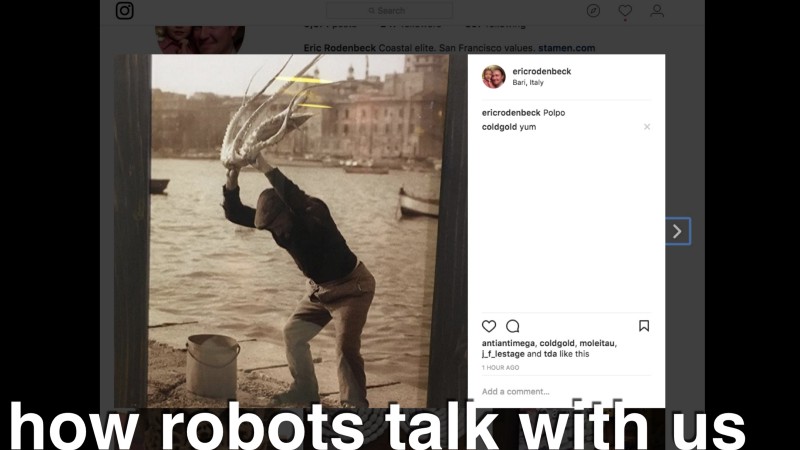
The job of this robot, what it does better than it does anyone else, is to keep you on the platform. It gets better and better at that all the time. And of course we’re talking about how these robots contribute to things in the news that are important to us, like the last US presidential election. It seems pretty clear that election was influenced in important ways by the activities of some fairly nasty robots. We’re seeing this all play out in the news every day.
I think we need to pay attention to these robots and how and what they see.
Maps of robots, made by robots
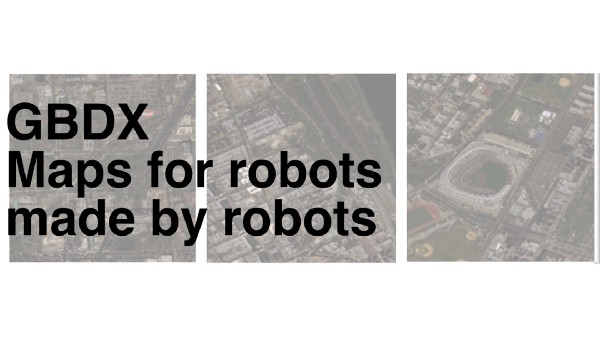
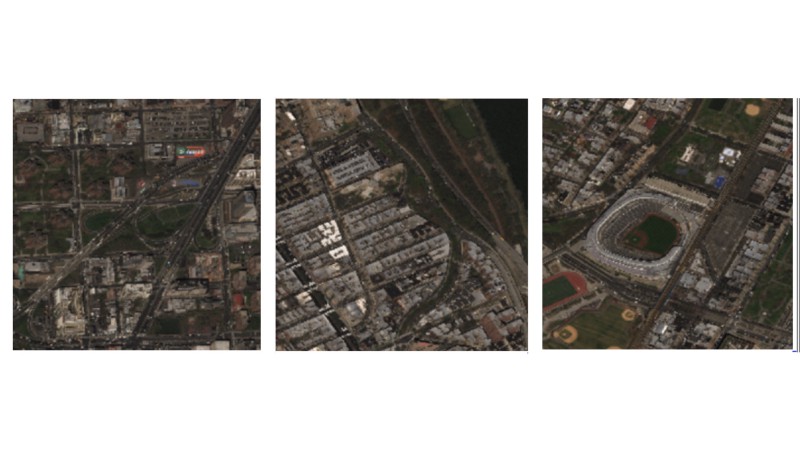
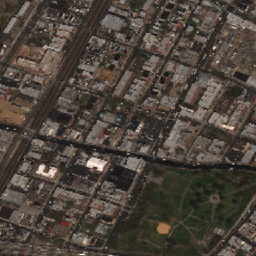
We start with satellite imagery. Digital Globe has a platform called GBDX that lets us query, at scale, different kinds of satellite images and do things with them. There’s a whole industry built around this, and we’re very interested and active in that space. The problem from the point of view of robot vision is that satellite images, on their own — once you get over the amazing fact that they are taken from space — are kind of boring. What’s interesting about them is their potential, and that’s what we decided to investigate. What can we do with these besides draw direction lines on them and count the number of cars in the parking lots of supermarkets? What can we ask AIs to do that humans can’t?
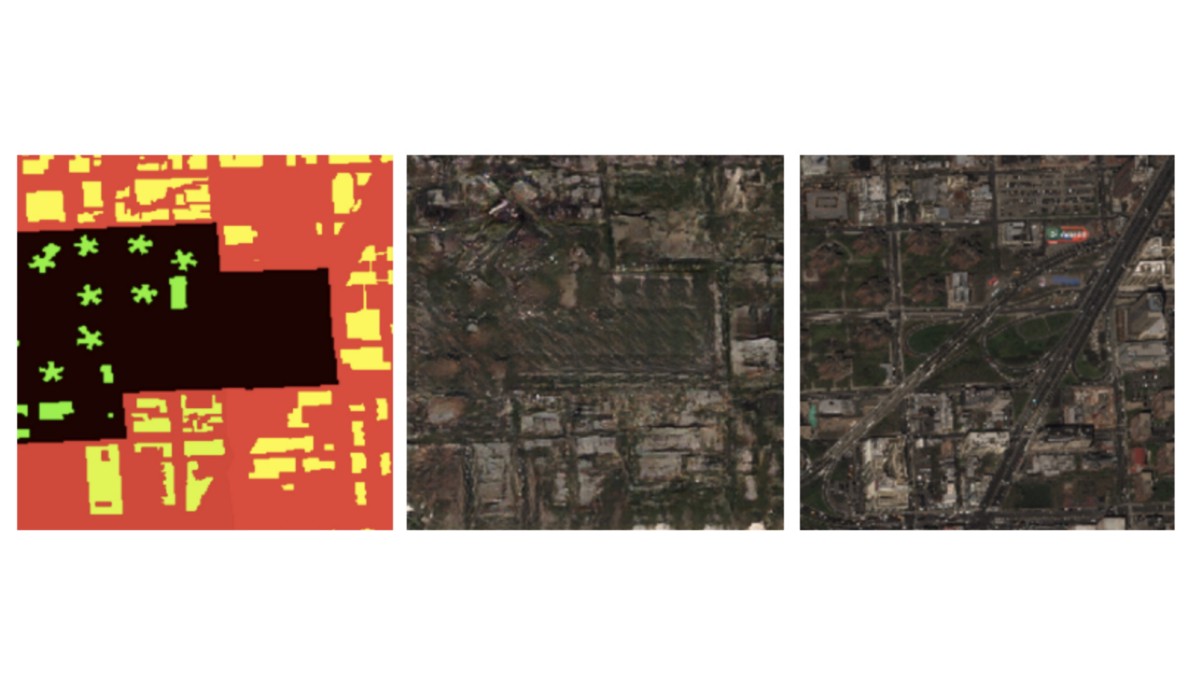
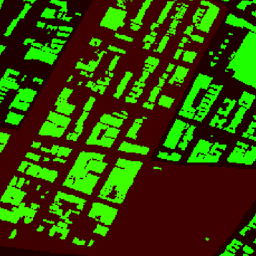
There’s lots of other information out there you can combine with satellite imagery, of course. For starters, we’ve been looking at the outlines of building footprints, provided by OpenStreetMap. These are the green parts of the following images. We’ve also been looking at demographic information, provided by the US census. That’s the red and dark red part of these images.
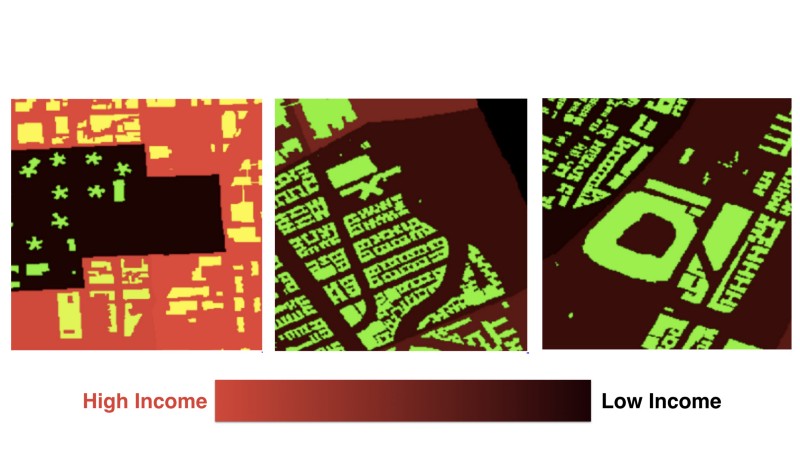
So the image above on the left is a high income area in red, surrounding a low income area in dark red with some tower blocks in them. That’s a housing project, which in the US is only for poor people, because we haven’t yet figured out how to have a decent society. And the two other images show middle-to-low income places with lots of buildings on them.
If you think about the world this way, you think about it as a number of intersecting layers that mean different things. And it turns out that robots can do some pretty interesting things with this idea.
Put two robots in a tank. Fight!
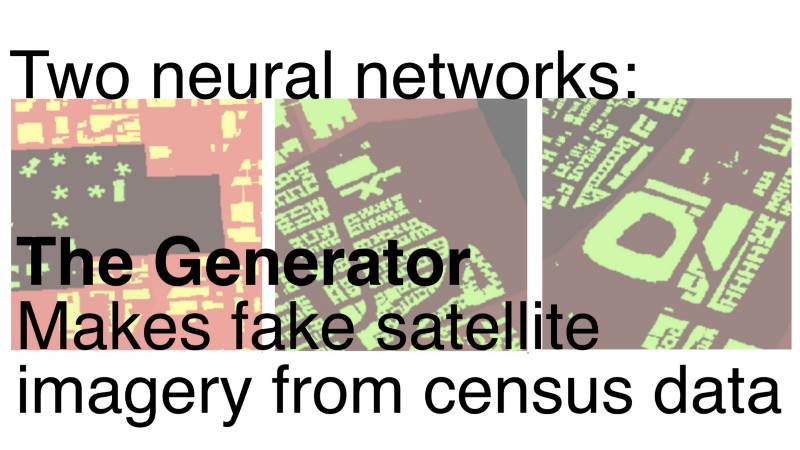
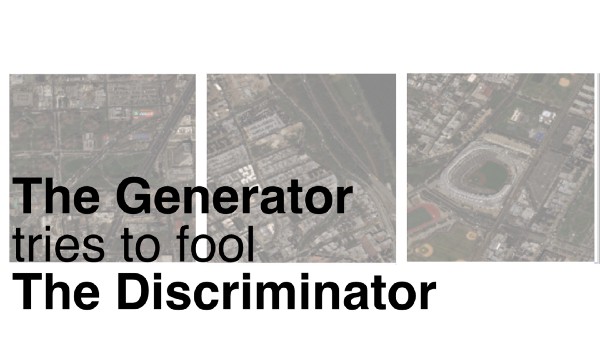
We trained two neural networks; basically two artificial intelligences that learn depending on what information you feed them. They’re robot “brains.” The first one is called the Generator, and it takes the red and green images and tries to turn them into satellite imagery.
The second robot brain is the Discriminator. It reads the images that the Generator makes and checks to see whether they’re real satellite imagery or not.
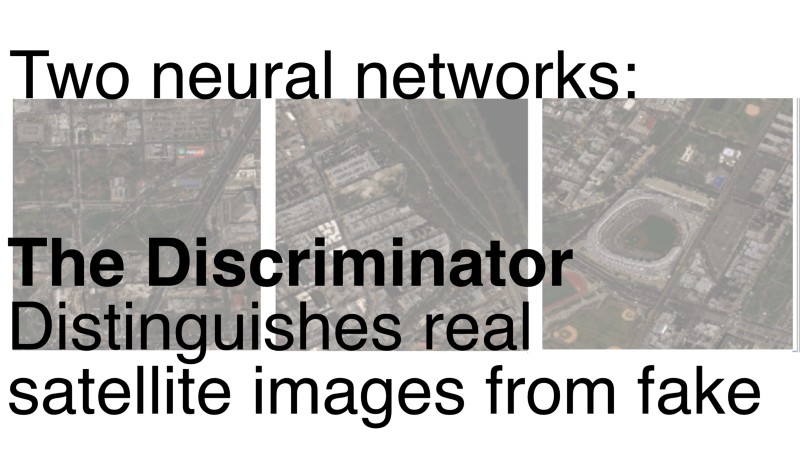
The Discriminator tells the Generator precisely how unlike satellite imagery its work is. So the Discriminator is very important, because it tells the Generator how to improve, very precisely.
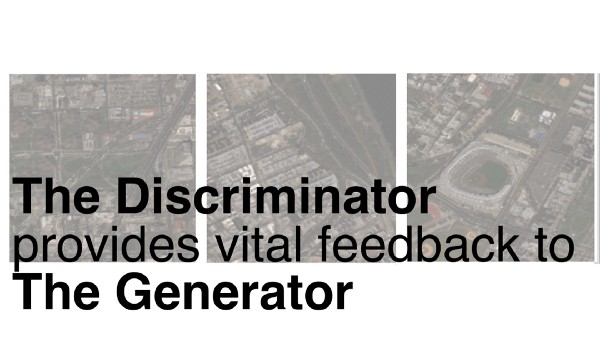
So you have these two robots trying to trick each other. One feeds the other fake images, and the other tells the first just how wrong these images are. Each one of them learns from the other, every time this happens. The Generator gets better at making realistic-looking satellite imagery, and the Discriminator gets better at distinguishing fake images from real images.
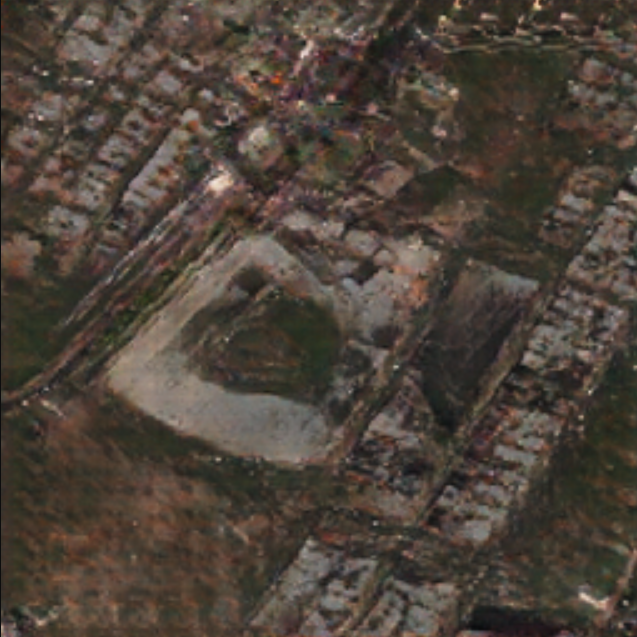
And then you repeat this process, a hundred times, a thousand times, a million times, it doesn’t really matter how many times, because they’re robots, and they don’t get tired. The Discriminator is always, slightly, ahead of the Generator. Eventually—sometimes quickly, sometimes slowly—the Generator gets really really really good at making satellite imagery. Remember this is still using the red-and-green images, the demographic data. Eventually the Generator makes something that looks enough like satellite imagery that the Discriminator says “OK, I recognize this as real.” The important part is that this new (fake) image now both looks good enough to fool a robot, and also brings along the demographic data with it.
Now we can draw our own satellite images. And we have a robot which will not only think it’s real, but also be able to tell something about the economic status of the people that live there. What should we do with that?

Well the first thing we thought to do was to make movies of fake-but-real-enough satellite data. Here are a few examples of what that looks like.
The first one is a pan along the East River of Manhattan. The order of these has been switched; the right hand side is census and building outlines, the left is satellite imagery, and the middle is the generated imagery:
The second is a zoom out and zoom in to Brooklyn, with generated imagery on the left:
The third one is where things get really weird. We’re looking at the corner of 16th and Mission, where Stamen HQ has been based since 2001. Instead of using real demographic data on the right hand side, we’re using fake demographic data. The bands of bright and dark red move independently of the building outlines. Remember that red is high income and dark red is low income.
So these are bands of high and low income, moving through the built environment. They’re like standing waves of gentrification that roll through a neighborhood, transforming a place and then leaving a trail of low income in their wake. And then right behind each one of those comes another wave of fancy coffee and single-scoop ice cream pop-ups and succulents on reclaimed wood tables. It’s like an animation of the logic of capitalism, reflected in the built environment in real time.
So what?
First of all I think these fun and cool and strange and new-looking and technically novel, and have the potential to get even weirder, and pursuing those kinds of things feels worth it in its own right and has served us well in the past. But there’s also something really creepy about these. My old friend and former Stamen Mike Migurski called them “deeply diabolical maps ‘by and for robots’” when I showed these at GIS Stanford last week. I like this idea that there’s an uncanny valley for satellite imagery just as there is for animated humans, where the robot will accept the images as real (and make predictions about wealth with them) but a human just…can’t…make it…resolve…
I also like being able to speculate with my eyes about what it would look like to be able to use artificial intelligences to test out what the impact and effect of capital investment or disinvestment will have on a neighborhood, city, region. This standing wave of gentrification idea is deeply unsettling. I want to explore the idea that you could make convincingly real models of what the effects of economic investment and disinvestment might have on communities, and share those artifacts, talk about them.
These robots may not be very smart or imaginative (yet) but they sure are thorough.
So this is all strange and weird and a little frightening to me, and I don’t really understand it very well yet. But we’re running out of time so we need to start thinking about these things seriously. The robots are coming! Look busy!
Whether or not this is how we see the world, this is what the robots see. There are more of them all the time, and they’re making decisions for us, and helping us plan. So it’s important for us to get better at talking about this, not just so we can critique it and hold back the wave of change that’s coming, but so that we can figure out what parts of it we want to encourage and use.
And so:
Robots see differently than people. They see order and disorder, structure and flow, much differently than we do. Some of this is worrying. Some of this is fascinating. We should talk about it more, and think about it with our eyes as well as our brains. It’s too important to leave it to the programmers.
This work is a continuation of work we’ve been pursuing with Digital Globe and Aman for some time now; we’ve been teaching classes in machine learning, and building artificial intelligences that can predict wealth from space. If any of this sounds interesting, please do get in touch!