For the last couple of months, Stamen Design has been lucky to have access to an internal beta of HERE XYZ, the powerful new mapping solution from HERE Technologies. XYZ is now available for public beta, so you can try it too! As you explore XYZ, we believe our experiences can serve as a guide to understanding the range of possibilities.
First, XYZ is built around the XYZ Hub API. One of the key concepts it offers is the notion of an “XYZ Space”. You can think of XYZ Spaces as extremely flexible geospatially enabled databases hosted in the cloud. At Stamen we really loved how easy it was to use the XYZ Hub API to connect XYZ spaces with a wide range of existing libraries, and in particular we loved how XYZ is agnostic about what front-end mapping libraries we wanted to use. In our exploration we visualized XYZ data using several of our favorite mapping tools: Leaflet, Tangram, and even a bit of flashy three.js.
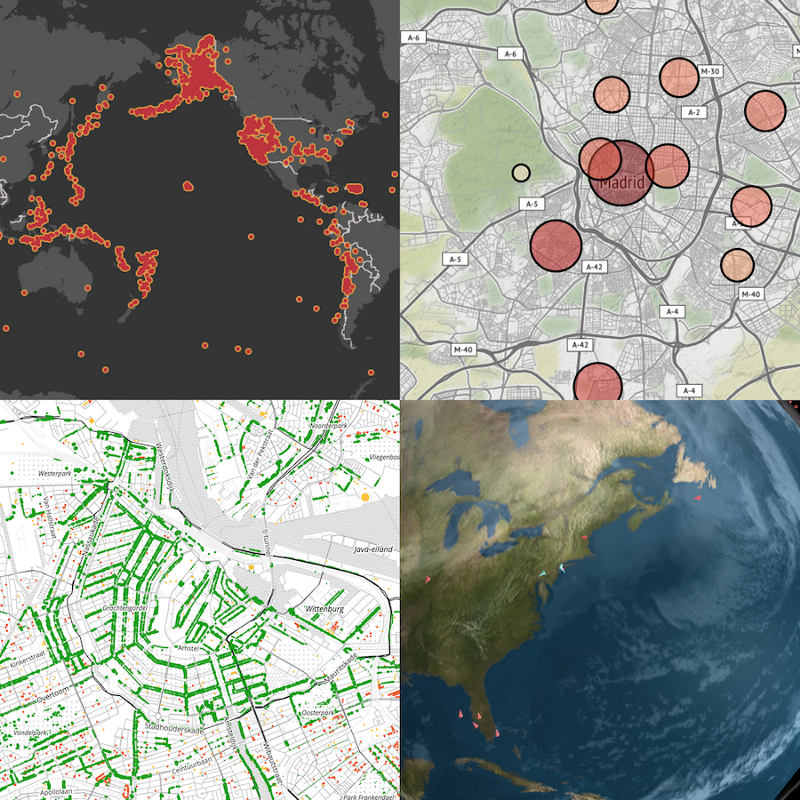
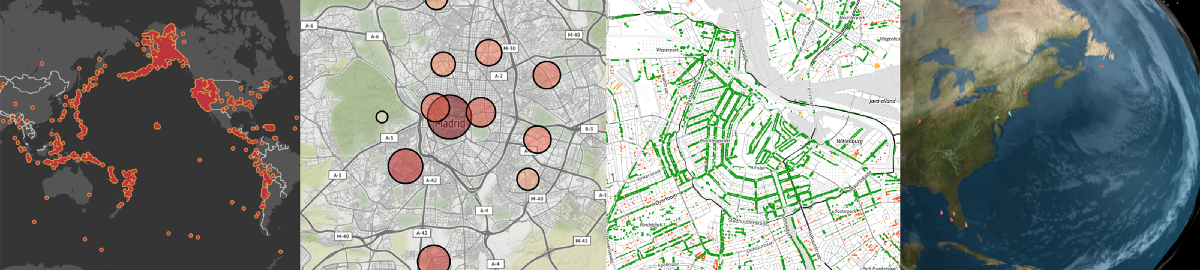
Over the course of our experimentation, we built four prototypes of increasing complexity, to demonstrate the capabilities of XYZ.
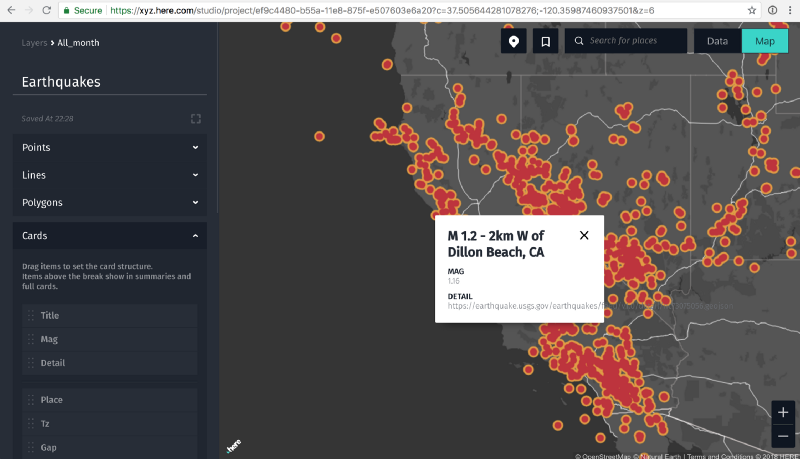
First, like any good web mapping platform, XYZ includes a graphical user interface called XYZ Studio. Without any code at all, you can upload data to XYZ, manage your spaces, and make a simple map. We tested out XYZ Studio by uploading some recent earthquake data. Within a matter of minutes, we had a shareable map.
- Live demo: Plotting earthquakes around the globe
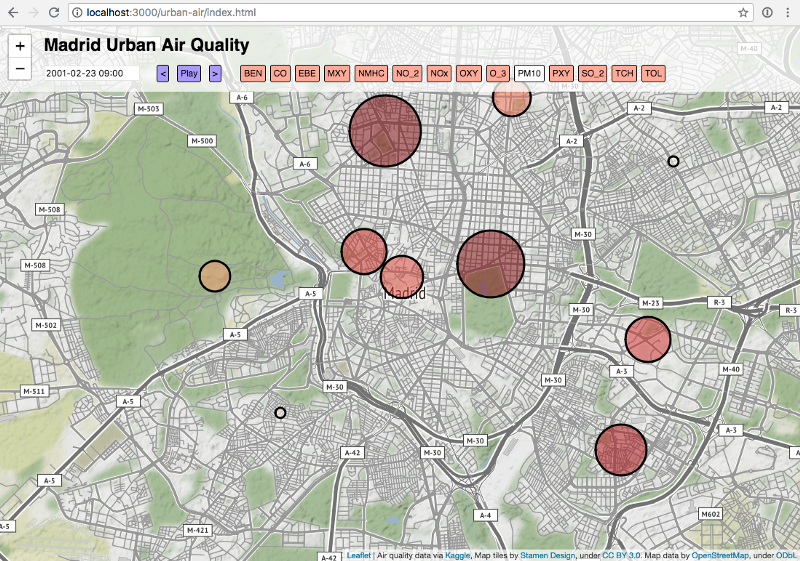
Querying XYZ spaces is organized around the concept of “tags”, which you can define at upload time or afterward, based on any attributes of your data. For our next map we wanted to test out this ability to query slices of data using arbitrary tags. We ended up with a Leaflet map of air pollution measurements for the city of Madrid. Try out the live map and see what happens when you select a new date or a different air quality indicator.
- Live demo: Mapping air quality in Madrid
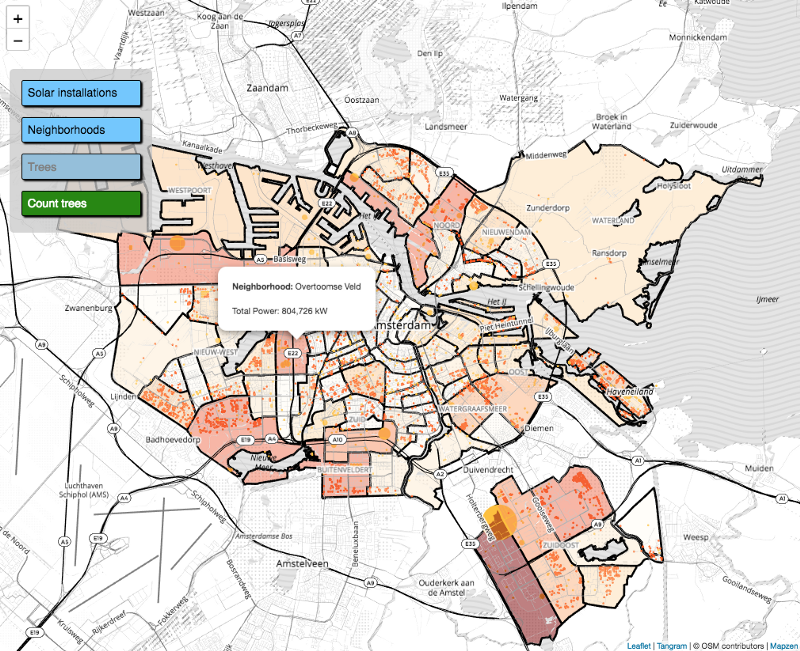
You’re also not limited to a single XYZ Space for all of your data. You can create multiple spaces (analogous to separate databases or different database tables) and access each of them with their own API endpoints. As we scaled up our experiments, we ran into limitations on the number of points Leaflet can render and on the size of our requests. So, for our next map, we tried out XYZ’s capability to serve up data as vector tiles, which we displayed in a multi-layer Tangram map. In this map, you can explore the solar power generation in various neighborhoods in Amsterdam, or draw a bounding box and count the number of trees in any part of the city.
- Live demo: Measuring solar power production in Amsterdam
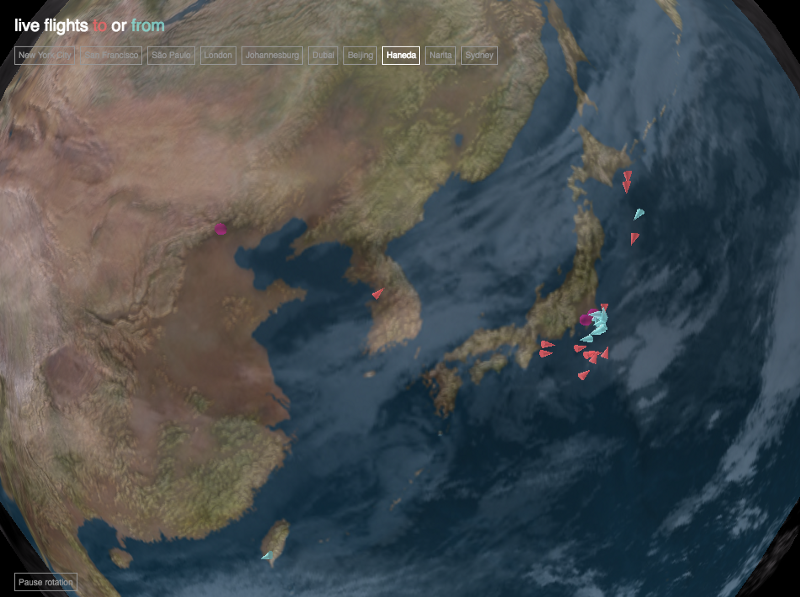
Finally, we wanted to push the limits of what was possible with XYZ, both on the back-end and with our front-end visualization. We set up a script to continually query a public feed of aircraft locations, and to push these automatically into an XYZ Space. Then we used THREE.js to draw planes in three dimensions above a spinning Earth. Take the app for a spin, and if you keep it open long enough you should see the positions of the plane icons update in near-real-time.
- Live demo: Visualizing aircraft positions on a globe
We also created four tutorials explaining how you can make your own maps like these. Yes, you!
In all, we’re pretty impressed with XYZ Spaces and we are eager to see what new features HERE keeps adding. So, what are you waiting for? Try XYZ for yourself now!