
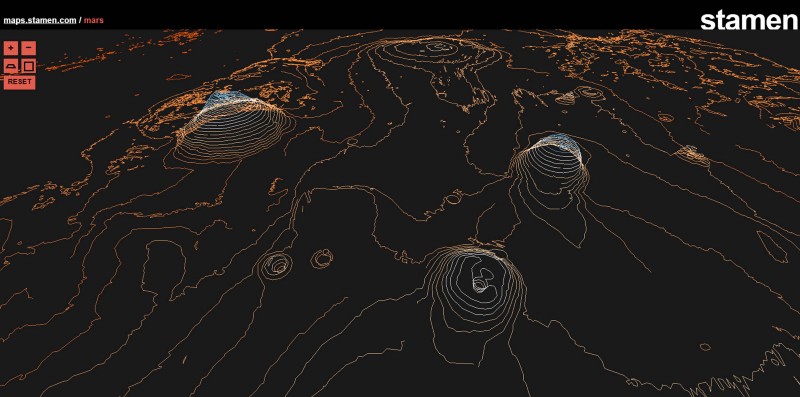
Stamen created maps.stamen.com to showcase our cartographic explorations. It’s also a place to stash our mapping experiments (Burning Map; Trees, Cabs & Crime). We recently added a new map: a three-dimensional map of contour lines that compose the surface of Mars.
1. Motivations
I started looking for space-related data shortly after hearing news of the NASA sequester (PDF). I wanted to show the value of freeing data produced by NASA, and at the time felt that the sequester would prevent investment in the technical infrastructure necessary to engage developers and citizens by making the data public. After much searching, I stumbled onto a dataset containing contour lines for Mars. Having breached 3D-in-browser in prior work — the Here maps, I realized that creating an explorable, 3D map of Mars was a simple project that would allow me to visit and traverse the surface of another planet.
2. Data
The most difficult part of creating the map was finding the data. I had a general idea of what I was looking for when I began (some sort of geo-located data), but was unsure of what NASA had available.
I recently attended a JPL/Caltech data visualization symposium with Eric, who wrote about the experience here. At the symposium, we spoke to several people at JPL about their “data problem”. What’s interesting is that we perceive the problem differently — NASA/JPL have petabytes worth of data and no way to get it to developers. Bulk downloads would take days if not weeks, and the current API offering is slim (but under active development). While they seem to be grappling with data storage and delivery, we’re having trouble with discovery. We don’t know what the petabytes of data contain, and there’s no single location to browse the totality of NASA/JPL’s data offerings. Furthermore, each NASA/JPL project has a different website, with a different navigation system, with different offerings in different formats.
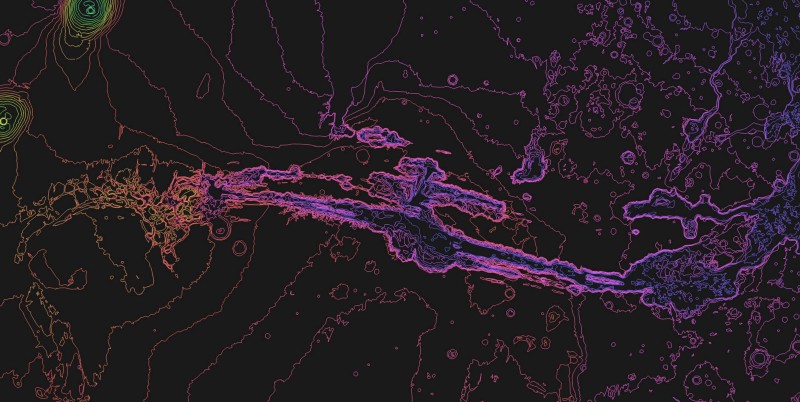
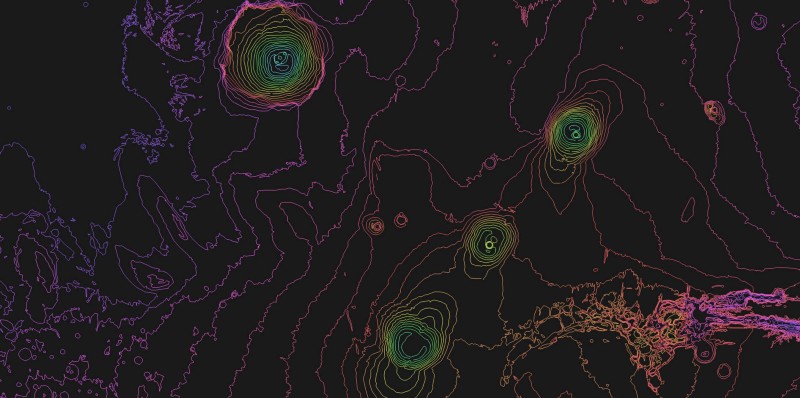
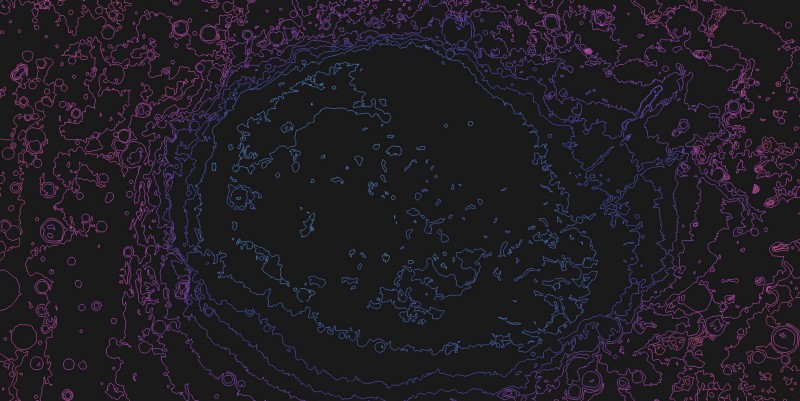
The data I eventually dug up out of the FTP site PIGPEN is a shapefile of Mars contour lines (see link at end of post) from the Mars Orbiter Laser Altimeter, or MOLA, an instrument aboard the Mars Global Surveyor. The MOLA dataset also contains height data, which is necessary for the conversion into 3D.
3. Method
I set up a Tilestache server to serve the shapefile as GeoJSON data, then seeded the entire tileset for several zoom levels since doing it live means a huge delay as the shapefile is re-read for every single tile. Once I had all the tile data cached in a locally-accessible directory, I used Polymaps to read the tiles into the frontend. Polymaps is also the map interaction and tile-handling layer, so that when a user pans or zooms on the (hidden) Polymap, the event handlers translate the motion into 3D coordinate-space. This means I don’t have to re-implement map movement and interaction and can focus on the trickier parts.
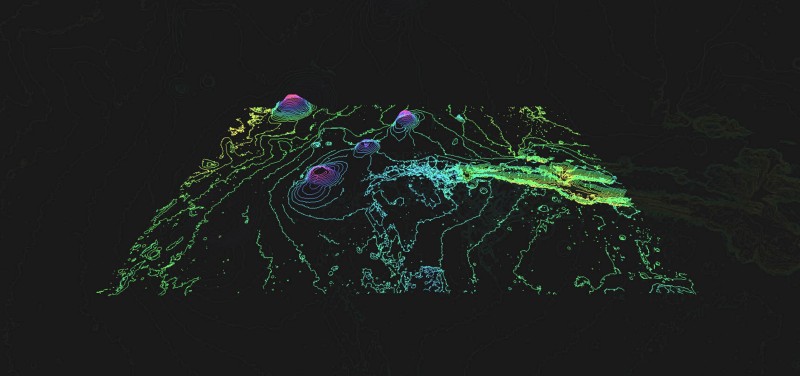
Once the tiles load in the frontend, the data is read and the 2D coordinates are drawn as lines in WebGL using Three.js, with the z-coordinate of each line defined by the heights specified in the original shapefile.
4. Future
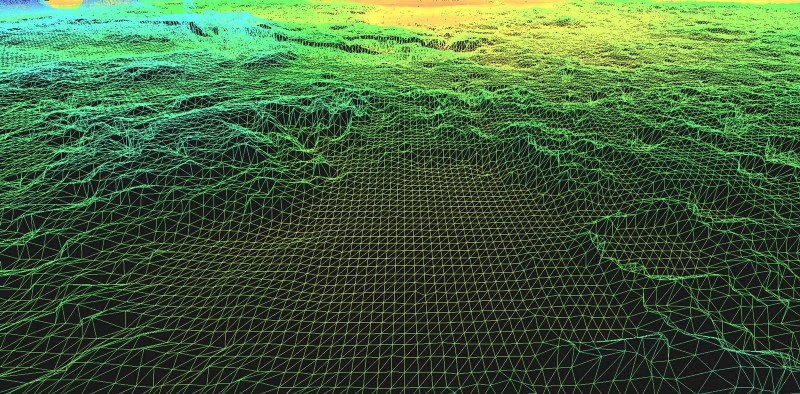
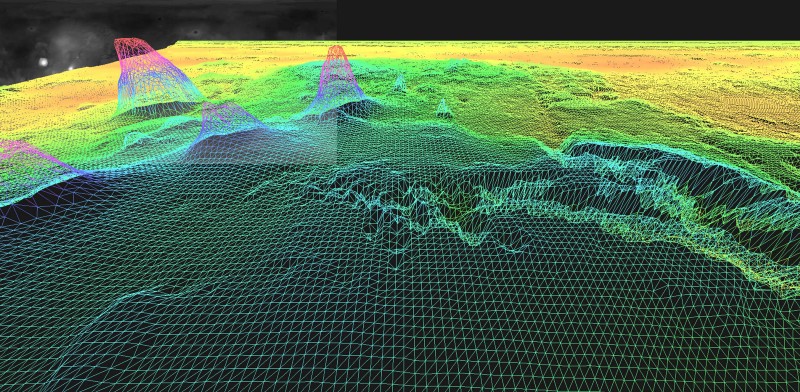
At a recent Mars hackathon, I had the chance to work with heightmaps, and am currently working on building an uninterrupted surface of Mars. We’re hoping to add more data layers to the maps so that they can be used as interfaces for intergalactic exploration, or maybe even educational tools.
Stamen would love to work with more spacey data. Recently, we’ve been speaking to some folks at the JPL, attempting to understand their data and figuring out how to make it more accessible for developers, who in turn can build interesting projects that will engage the public and hopefully garner more awareness and support for NASA programs.
5. Resources
- Mars Contours (from NASA’s PIGPEN FTP repository) ftp://pdsimage2.wr.usgs.gov/pub/pigpen/mars/mola/contours_shapefiles/
- NASA Sequestration Memo (PDF)