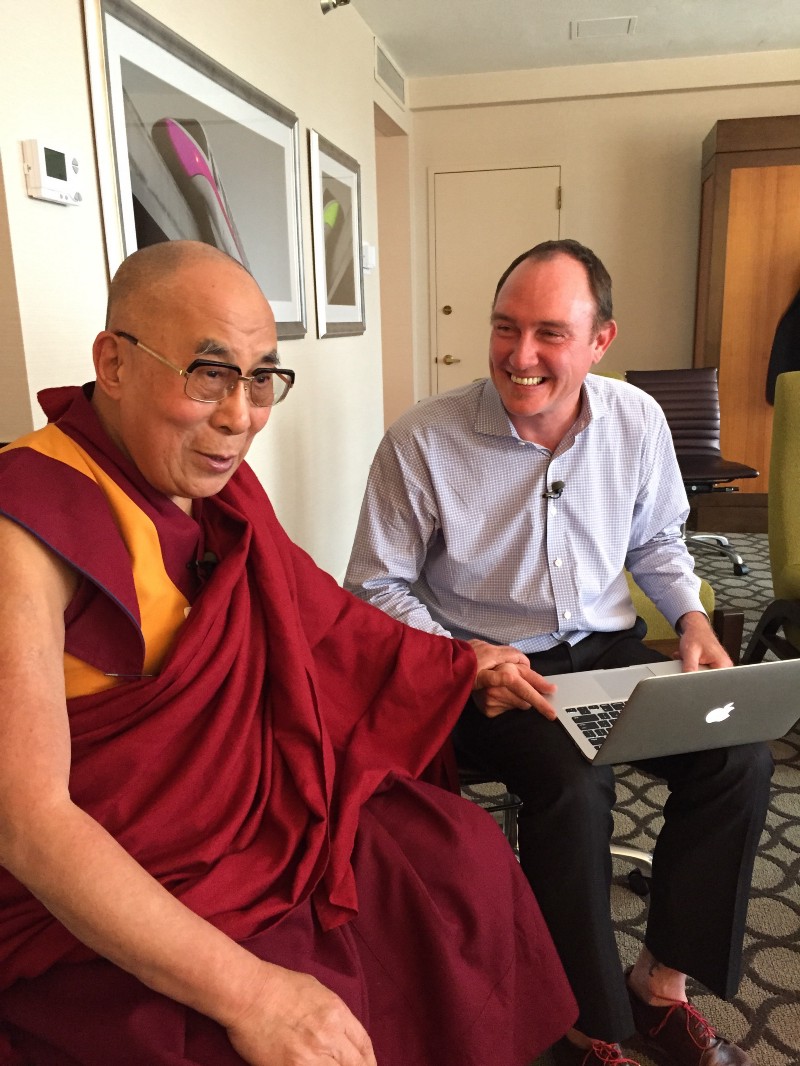
In 2014, the Dalai Lama asked his friend, scientist Dr. Paul Ekman, to design him an Atlas of Human Emotion. His Holiness was intrigued by conversations that he and Paul had been having over the years about their different views on the subject of emotion. His Holiness comes, of course, from the Buddhist tradition. Paul’s more Western view comes from over 60 years of having studied emotions all over the world, in places as far-flung as Papua New Guinea and as close to home as UCSF. The Dalai Lama has been learning about scientific understandings of emotions from Paul and his work. For example, the concept of mood is missing from the Tibetan worldview, and he’s expressed delight in this new knowledge several times.
In 2015 Paul and his daughter Dr Eve Ekman, who also studies emotion, reached out to me and asked Stamen to collaborate with them on the design and concept of this Atlas. To say that I’m delighted to be able to share this work, featured today in the New York Times, is the understatement of the year — perhaps of my professional life.
The concept was originally to design a single map that would guide emotional travelers and help people find a state of calm. Over time, in close collaboration between Paul, Eve, and Stamen, the idea grew into a collection of maps, each representing a different aspect of the science of emotion.
The first step was for Paul to conduct a peer-reviewed study on What Scientists Who Study Emotion Agree About. The consensus among nearly 250 scientists studying the subject is that five emotions can be considered universal, in the sense that all humans experience them, regardless of culture: Anger, Fear, Sadness, Disgust, and Enjoyment. Each of these emotions has its own map in the Atlas, and each has its own special character.
There’ve been a number of interesting challenges. First is that our principal source of data is an 82-year-old scientist who’s a genius, following in Charles Darwin’s footsteps, so creating a graphic distillation meant sifting through 60 years of research to determine what was most relevant for the screen. It’s great fun, translating complex scientific concepts and data into easily understandable visuals and maps, but it’s not without its obstacles.
Another is that, while some of the science is unequivocal, some of it is still very much a work in progress. Paul often says things like: “We know a lot more about Fear than we do about Anger or Sadness, because it’s much easier to reliably and ethically frighten someone in the lab than it is to make them angry or sad.” So the process of making this Atlas has been closer to how people used to make maps before GPS; we had to come up with a system of representation for the known world as well as for the less well known. In some ways this has been the trickiest part; to express ideas visually and crisply even though the data has varying levels of accuracy and reliability.
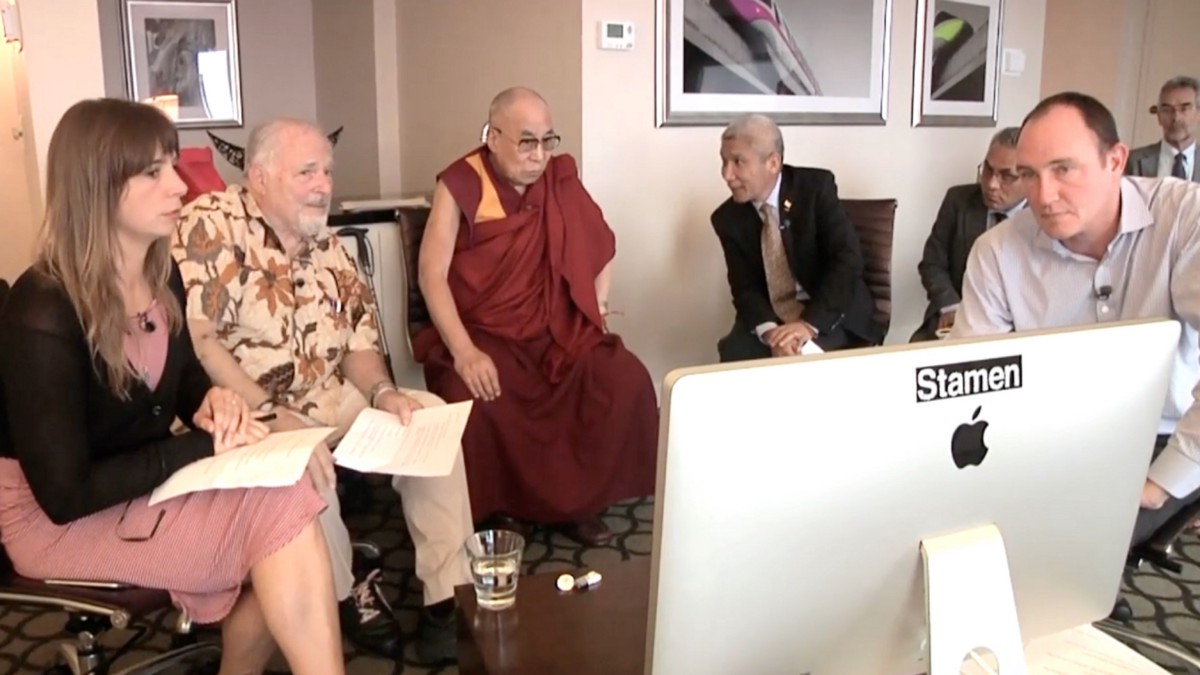
Also, as we discovered, it’s not like there’s a preexisting emotion data set to visualize! After several different rounds of back and forth, trying and failing to shoehorn the project into a standard data visualization process, I realized we were going to have to take another tack to be successful. I proposed that I sit with Paul and Eve directly over several months and draw out ideas on paper in order to develop a model and understand the material, and they graciously agreed. We went through several rounds of design and build, including a throughly enjoyable round with our friends at Presence here in San Francisco. So in addition to an interactive atlas, we’ve got a giant leather notebook full of drawings about how emotions work.
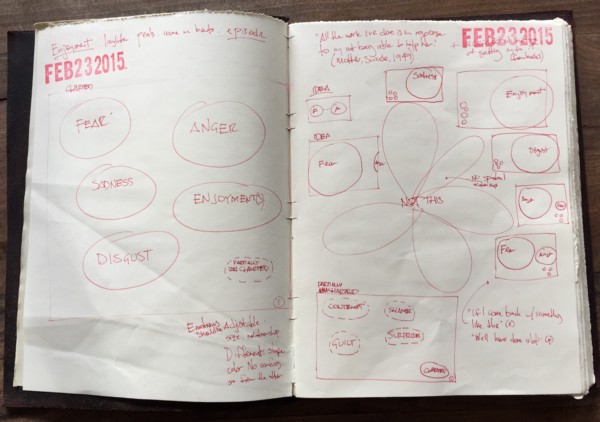
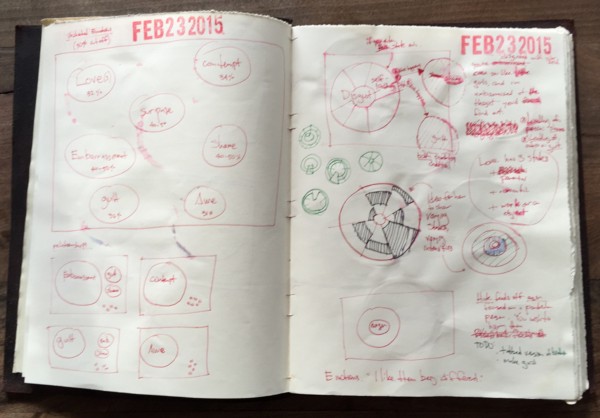
Drawing data visualizations in a notebook for the Dalai Lama with one of the 20th century’s great scientists and his daughter has been one of the best and most challenging experiences of my life.
This project attempts to bridge a difficult gap: that between the academic and the personal. We wanted to take scholarly findings about emotions and make them accessible without simplifying them to the level of saccharine self-help tools, of which there are plenty already. We’ll be writing more about the project in the weeks and months ahead, but for now we invite you to enjoy http://atlasofemotions.com and to let us know what you think.
Key Atlas concepts:
- Emotions are at the core of what makes us human. From a scientific perspective, they helped us evolve and survive.
- Emotions are distinct from one another. They don’t overlap in their nature, but they can coincide in time.
- Each Emotion has several States, which vary in intensity. These are very specific: you can’t be only slightly Furious, for example. But you can be mildly Annoyed as well as highly Annoyed. So the State of Fury is narrow and steep, and the State of Annoyance, which extends from low to high along the scale of intensity, is very broad at the base.
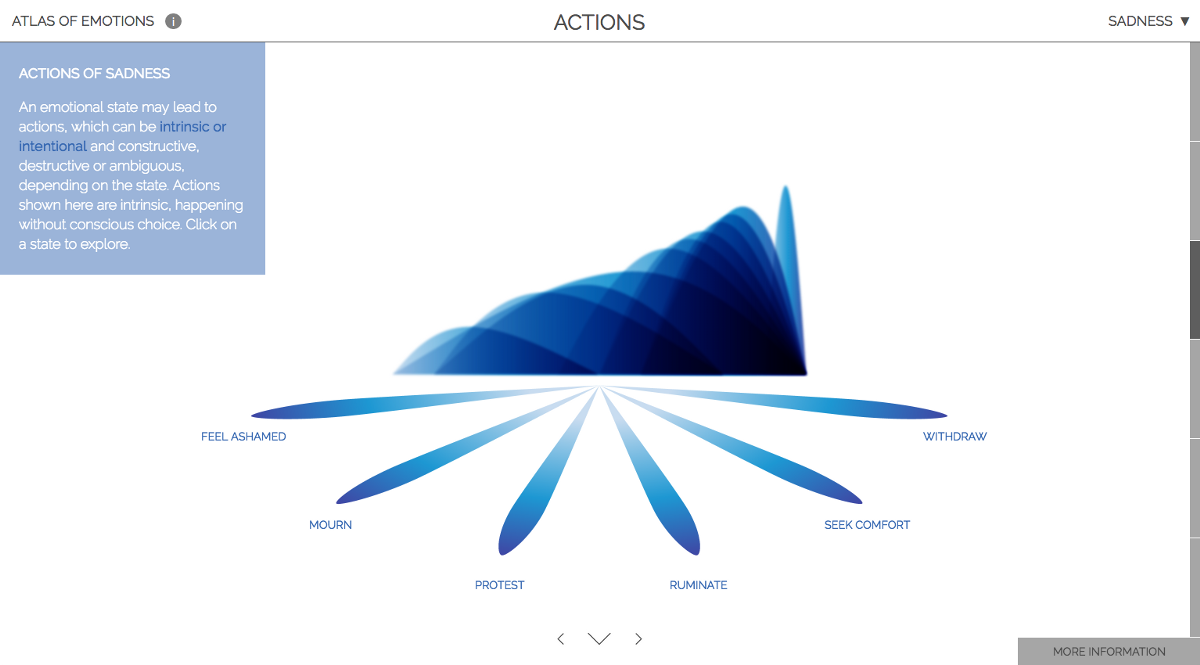
- Within each Emotion, each Emotional State has Actions associated with it, which result from experiencing these States. Some Emotions, like Anger, have a large number of potential Actions associated with them. Disgust, on the other hand, has very few.
- Each Emotional State is caused by a Trigger, an involuntary reaction to an event or a thought.
- Each Emotion is associated with a particular Mood, which causes events or thoughts to be more easily associated with that Emotion. So an Irritable Mood causes a person to interpret events or thoughts more Angrily.
- A clearer understanding of one’s Emotions can contribute to the feeling of a Calm State, which is a state of mind that is actively engaged in using intelligence and wisdom to evaluate the changing world.
Final URL: http://atlasofemotions.com/ Press release here.
Media inquiries: elizabeth.stampe@gmail.com
A Stamen Design project https://stamen.com/ Follow us on Medium.