Here’s the final entry of a week of posts about the maps.stamen.com launch. As the launch of our new maps neared, I created a tool for us to look at how people are using the maps.
Pre-Launch
To speed up the loading of the maps, we try to pre-cache the map imagery. One problem. The Earth is big, and, no matter how popular, only a small percentage of it will actually be looked at on our maps. It would take our server years to render the entire world down to zoom 13 which still leaves 5 zooms levels uncached. We have some tricks to address this problem like only pre-caching areas with land, but this topic is one Nate is going to cover in the near future. Now ten days after launch, we wanted to see how people are using the map so in the future we can improve our pre-caching.
Tiles
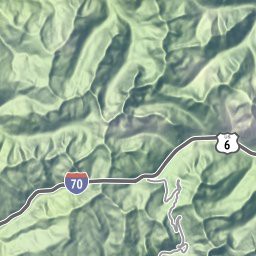
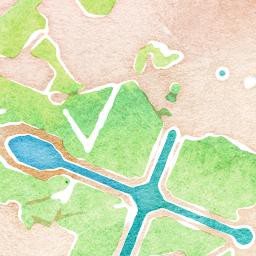
First some background. Currently, most interactive maps on the internet are made of 256×256 pixel images called tiles (map tile background). Using tiles allows maps to load dynamically as you pan and render out the geometries for a bounded area making the image generation faster. Here we have a 3 tiles from our new basemaps at zooms 11, 12, and 14 respectively.

Maps
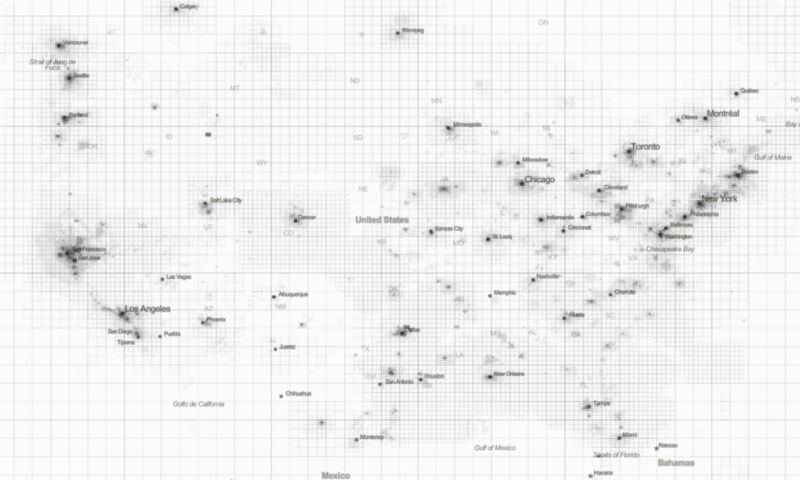
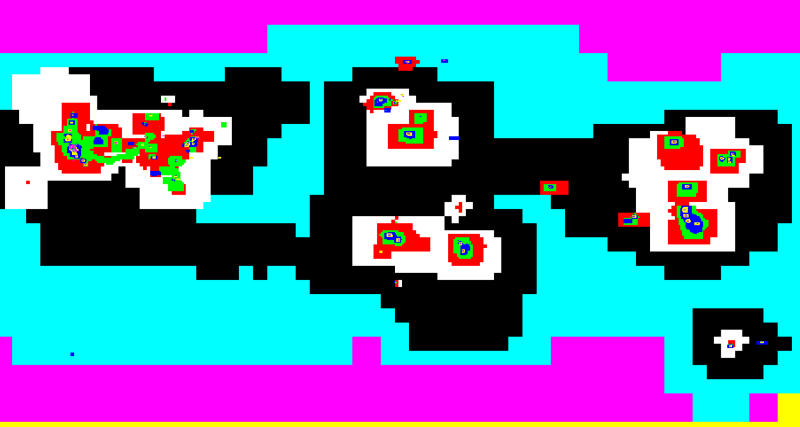
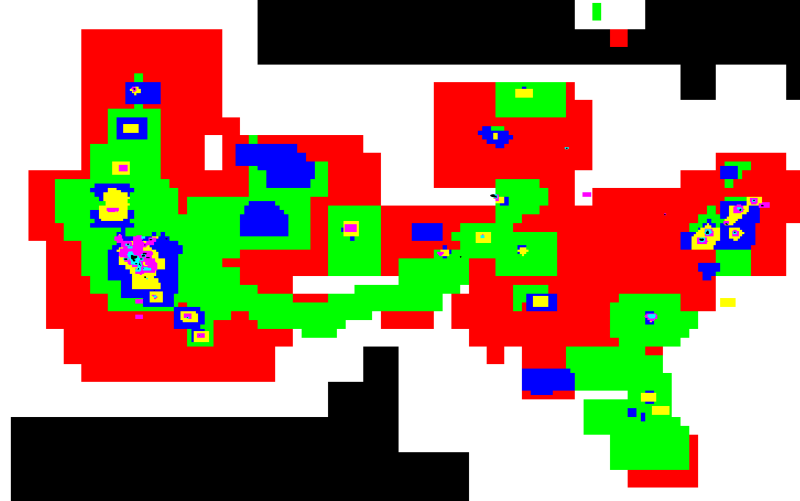
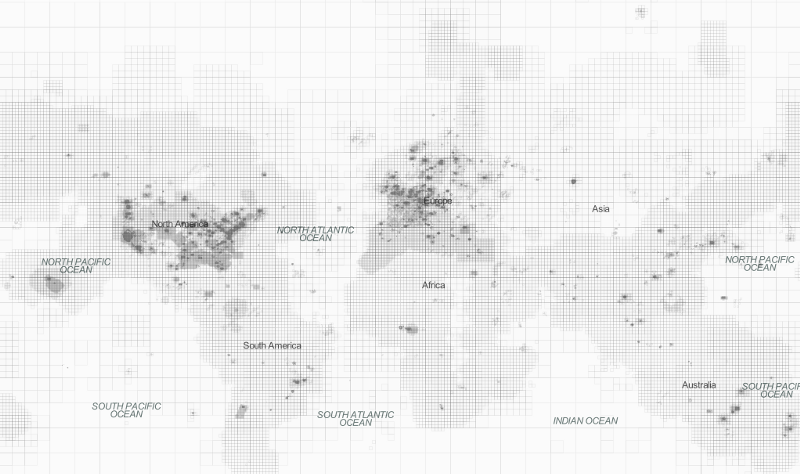
Like any other page on the Internet, as people browse the maps, server logs are generated which give us a list of tiles that were downloaded. I rendered this data out showing each tile at its location and area it takes. The smaller squares represent the 256×256 pixel images but at a higher zoom level. The colors cycle through the zoom levels.
This is the world for Toner which has been in testing for a few months. Europe and Africa are in the middle. For North America, Florida and the bi-costal densities are the only defining features. South America is absent.
Here is the same dataset but focused on the US. The Bay Area has been looked at heavily, likely due to internal testing use on local projects. The green smile across the bottom is likely someone following a highway, maybe I-20/30.
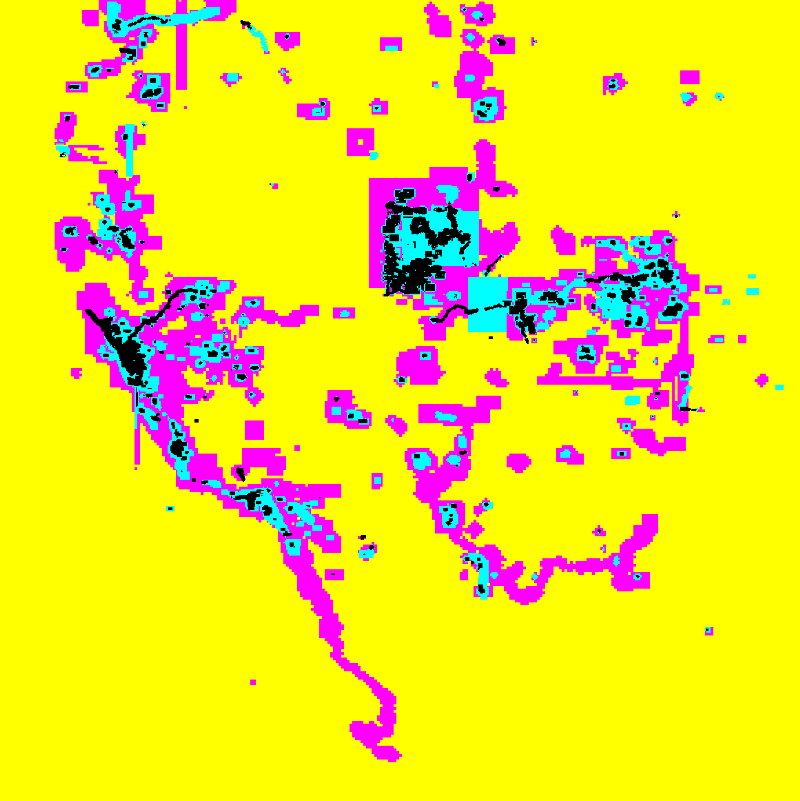
This map is the terrain map pre-launch showing the western US. The coastline from San Francisco to Mexico has been examined. Also, a large amount of Utah was looked in fine detail. This area is very sparse of population but likely someone looking at the hill-shading.
We were intrigued. This map of what people look at on maps was something we hadn’t seen before. There was more detail than the initial static images could show so I turned it into a tile-server so we could make it interactive progressively showing more detail as you zoom in.
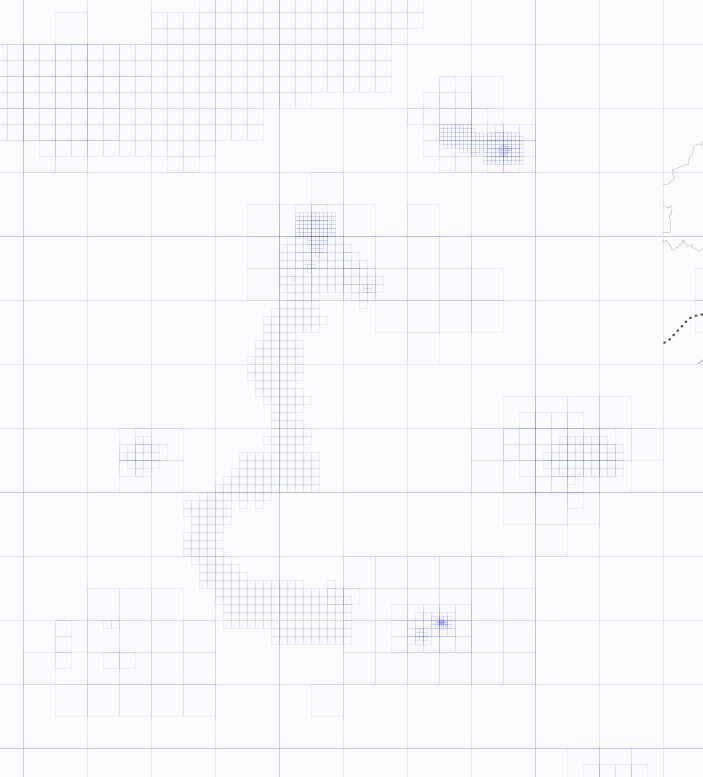
Here, viewing the grid of tiles, someone appears to have followed a river.
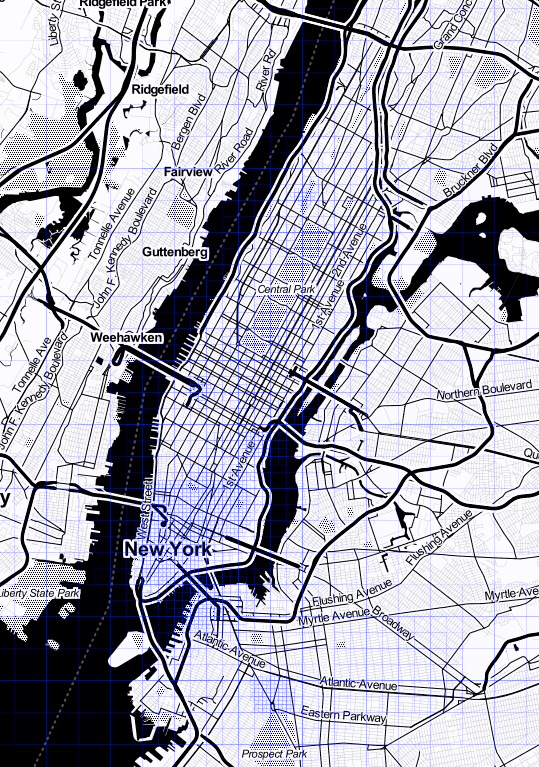
The Northeast corridor for all 3 tilesets.
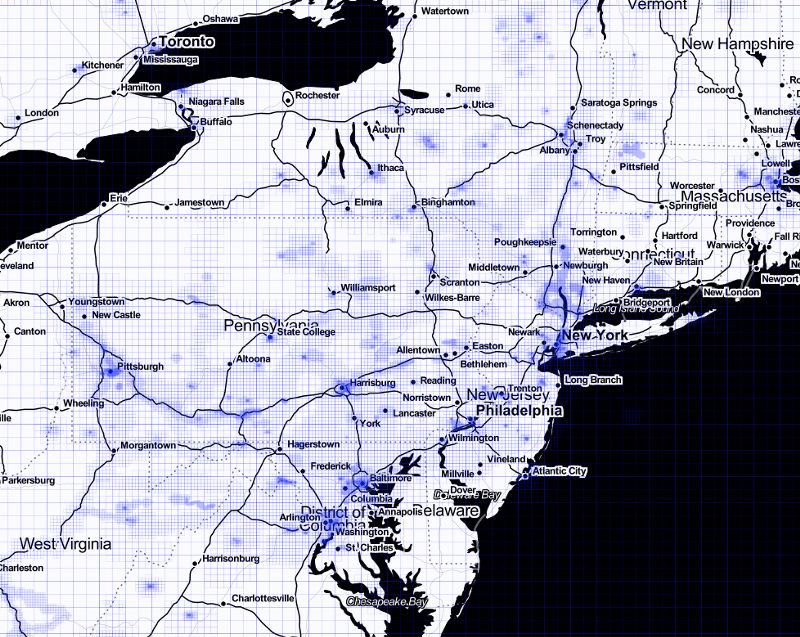
In New York City, Wall Street, Dumbo, and Park Slope are getting looked over most closely.
Post-Launch
These are the log maps for just Watercolor over the last 10 days. They represent 1.2 million tiles served of which 350,000 were unique. As we saw previously, the US and Europe get a lot of viewing.
Not surprisingly, the map viewing correlates with city labels. The exceptions are along the coasts north of Los Angeles and of the Carolinas and Georgia.