maps.stamen.com, the second installment of the City Tracking project funded by the Knight News Challenge, is live. These unique cartographic styles and tiles, based on data from Open Street Map, are available for the entire world, downloadable for use under a under a Creative Commons Attribution 3.0 license, and free.
*takes deep breath*
There are three styles available: toner, terrain, and watercolor:
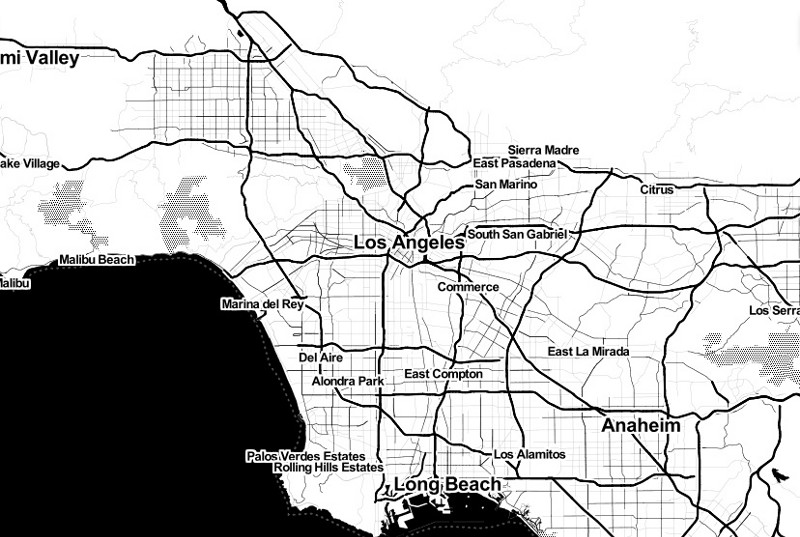
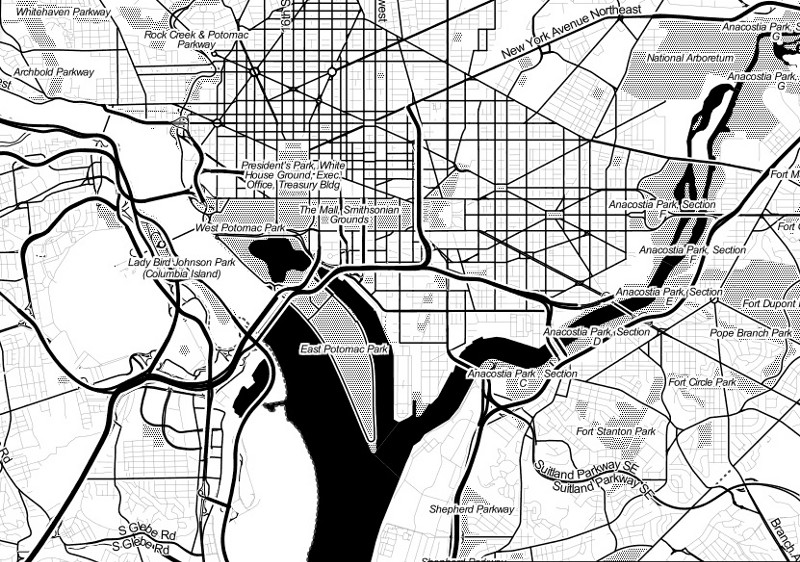
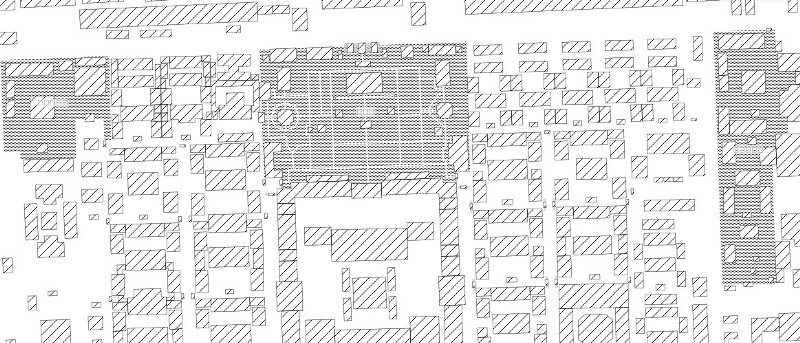
- Toner is about stripping online cartography down to its absolute essentials. It uses just black and white, describing a baseline that other kinds of data can be layered on. Stripping out any kind of color or image makes it easier to like focus on the interactive nature of online cartography: when do different labels show up for different cities? what should the thickness of freeways be at different zoom levels? and so forth. This project is the one that Nathaniel is hacking on at all hours, and it’s great to be seeing Natural Earth data get more tightly integrated into the project over time.
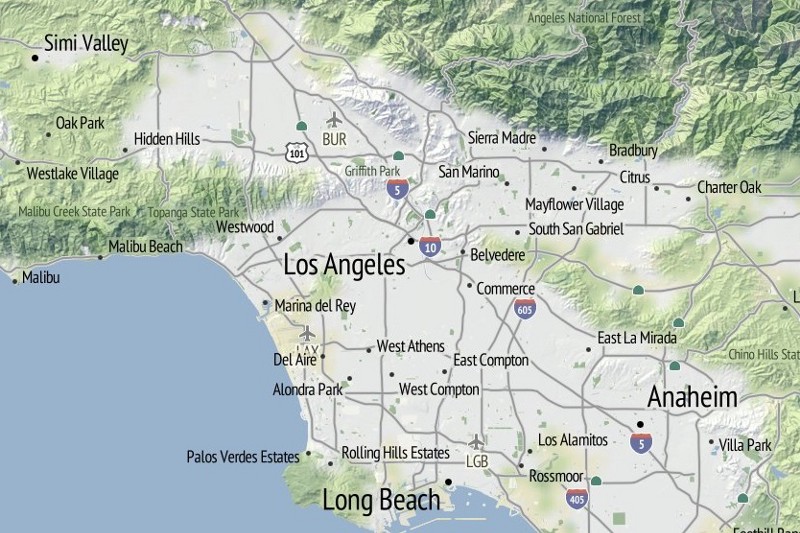
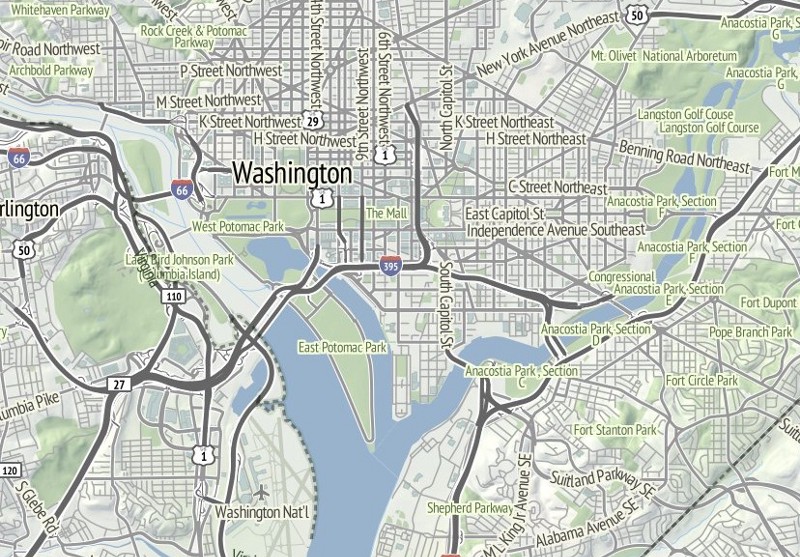
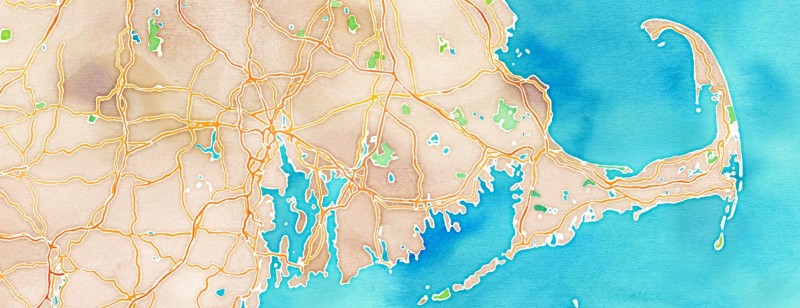
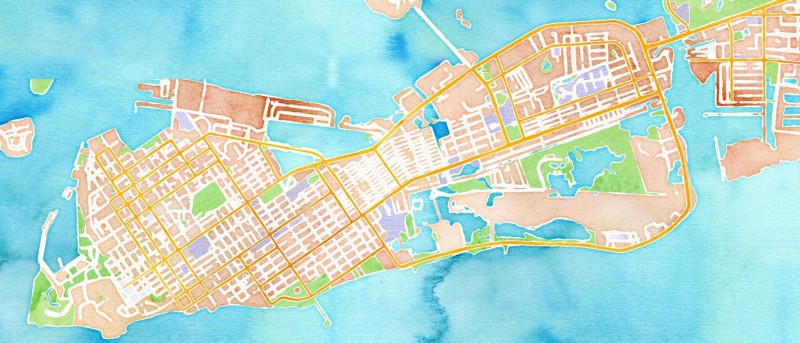
- Terrain occupies a middle ground: “shaded hills, nice big text, and green where it belongs.” In keeping with City Tracking’s mandate to make it easier for people to tell stories about cities, this is an open-source alternative to Google’s terrain maps, and it uses all open-source software like Skeletron to improve on the base line cartographic experience. Mike has been heading up this design, with help from Gem Spear and Nelson Minar.
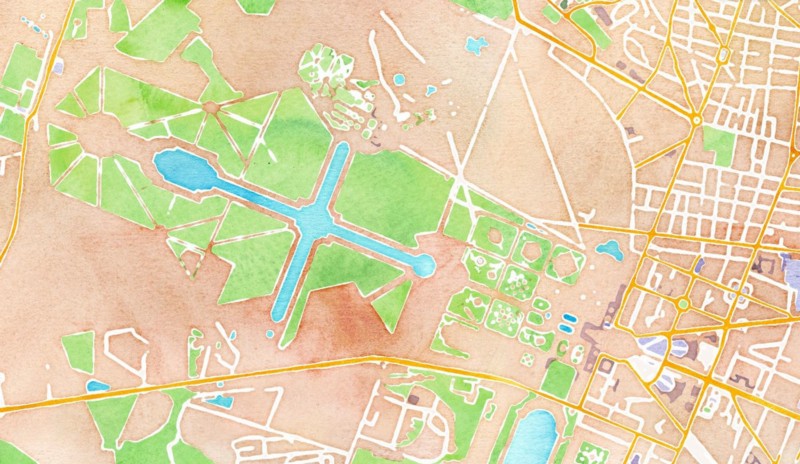
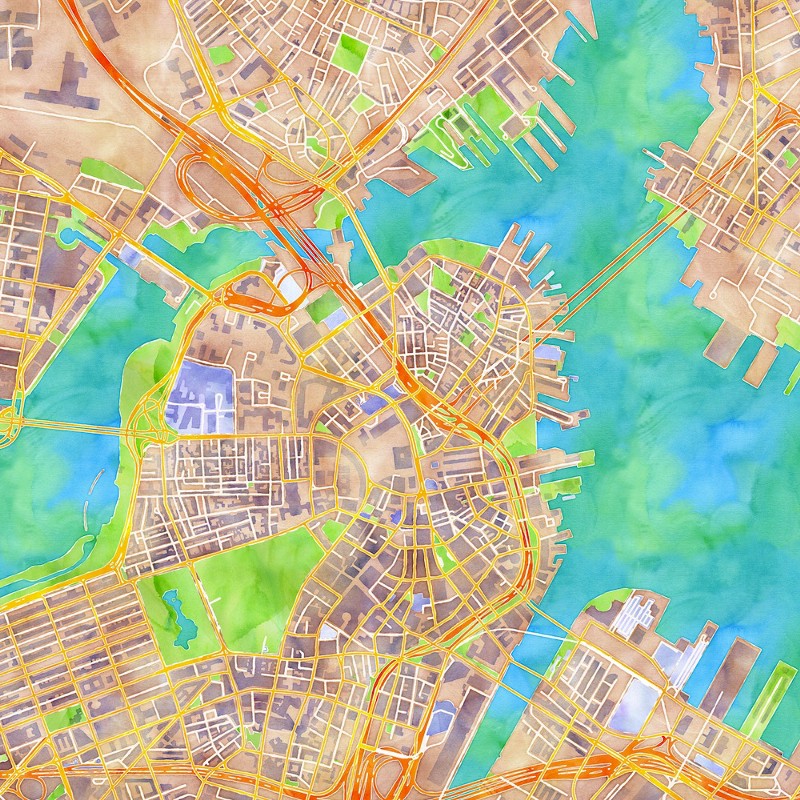
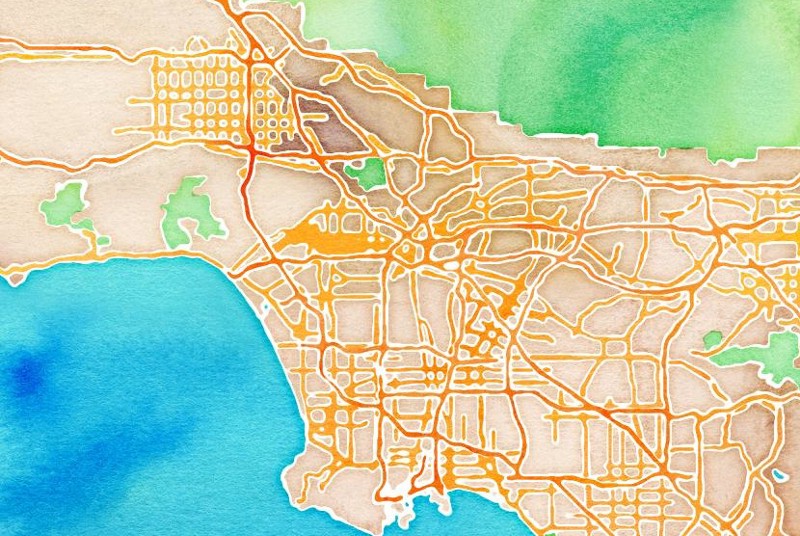
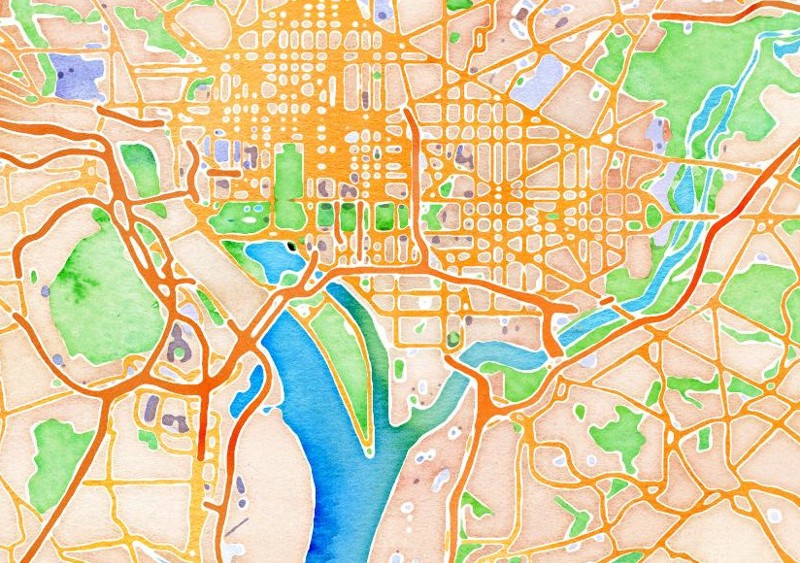
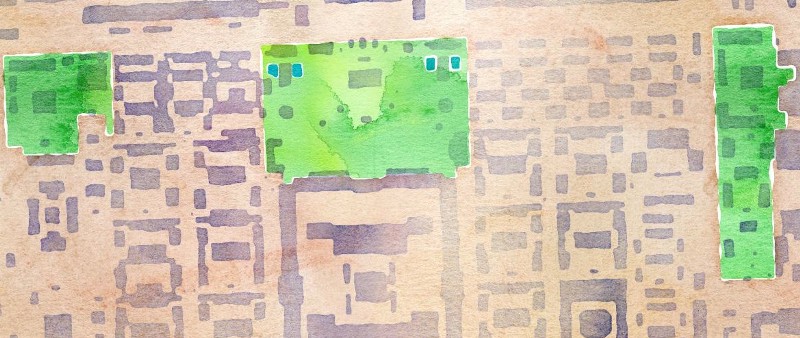
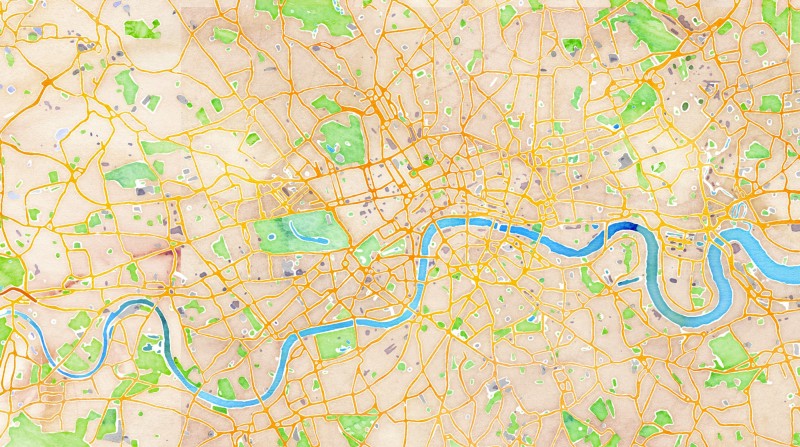
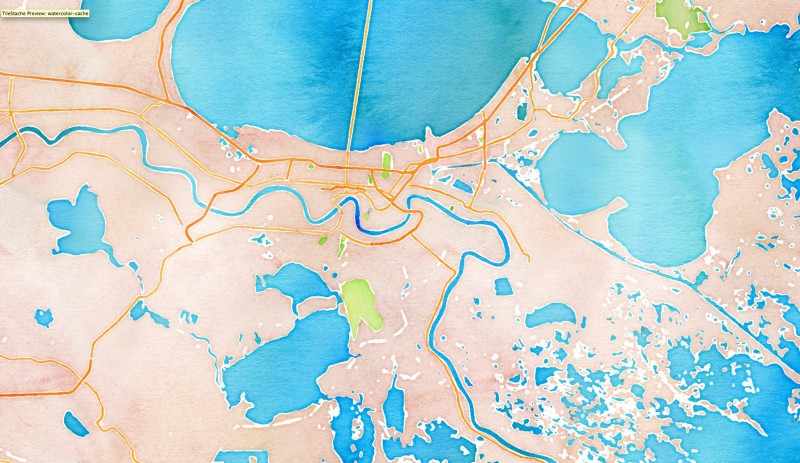
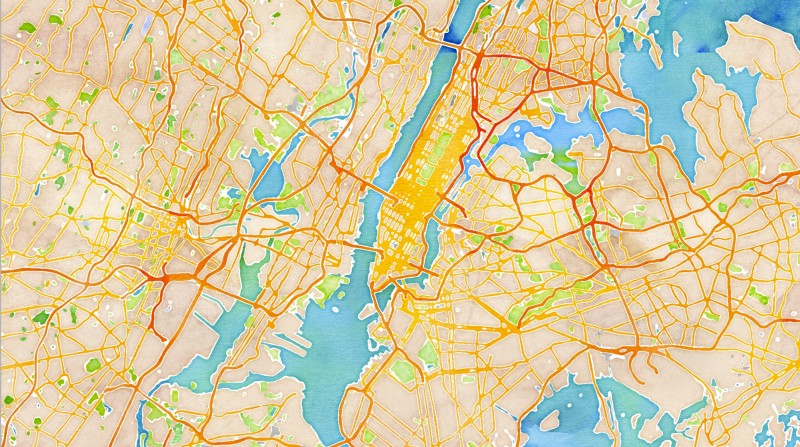
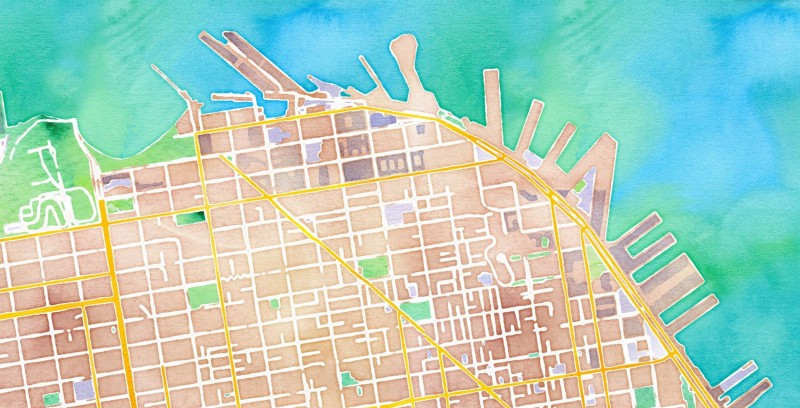
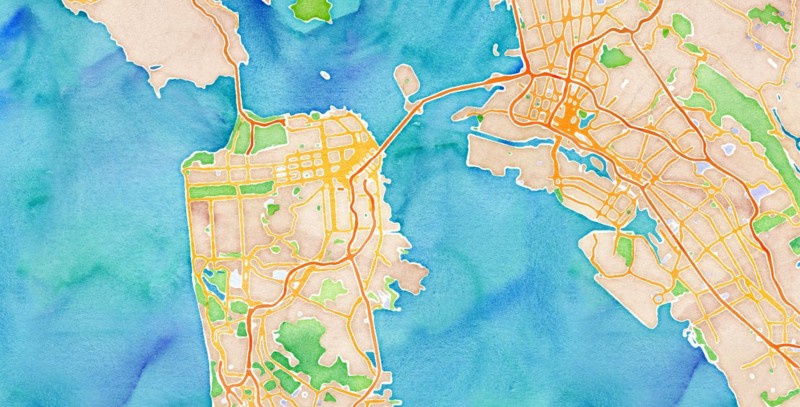
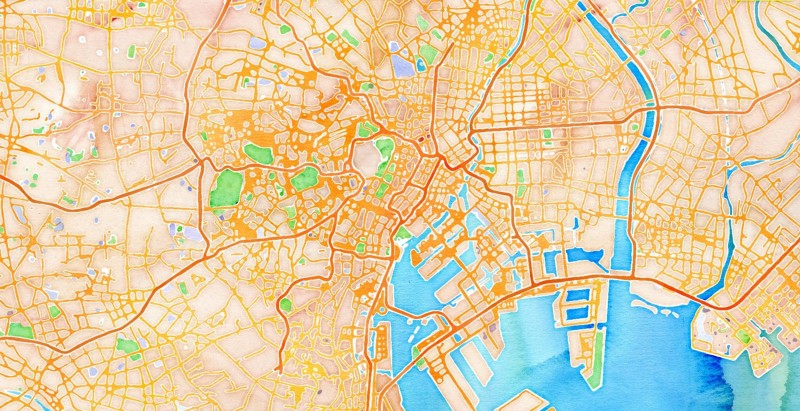
- Watercolor pushes through to the other side of normal, bending the rules of traditional legibility in order to explore some new terrain. It incorporates hand-painted textures and algorithmic rule sets into a design that looks like it’s been done by 10,000 slaves in the basement, but is rendered on the fly. Geraldine and Zach did the lion’s share of the design and development on this one. This design is a mixed bag for me: I’m delighted to see it out in the world, but it’s the thing that’s pretty much kept me from looking at anything else for the last month and a half.
The code that runs Toner and Terrain is available for download and use at the Citytracking GitHub repository; watercolor we’re going to wait on a little while until we can get some of the kinks ironed out. We talked about waiting to launch until watercolor was all buttoned up but what with all the attention that Open Street Map has been getting we decided to just bite the bullet and go for it.
We’ll follow up this week with some posts on how everything works and how the sausage is made, and I’ve got a lot more to say about what I think this implies for what can be done with online maps and data visualization. In the meantime, have you seen how awesome Los Angeles, Washington DC, The Forbidden City, Massachussets Bay, Key West, London, New Orleans, New York, Versailles, andevery other city in the cotton-pickin’ world look when you point this thing at it? Holy heck.
Los Angeles
Washington DC
The Forbidden City
Massachusetts Bay
Key West
London
New Orleans
New York
San Francisco
Tokyo
Versailles