
A personal history of OpenStreetMap, seen through the eyes of Stamen Design
by Alan McConchie, Eric Rodenbeck, and the Stamen Design team

Last month, we were interviewed by Steven Feldman for The Geomob Podcast about Stamen’s history using OpenStreetMap (OSM). This stimulating conversation gave us the chance to get a bit nostalgic and think back on this long strange trip we’ve been on with OpenStreetMap. For certain, OSM is the dataset that Stamen has used the most over the years, but OSM is much more than a dataset. OSM is many things, a (mostly) leaderless organization, a community of communities, and in a sense OSM has been Stamen’s longest collaborator. We are not OSM’s client, nor are they ours. Maybe the best way to put it is as a long-running friendship, as both Stamen and OSM each have their own personalities, and each has changed and matured through the years, sometimes growing closer together, and other times following our own paths.
So come with us, if you will, as we stroll down memory lane and think back on the many good times with our BFF, OpenStreetMap.

Part 1: worlds of possibilities, 2005 — 2011
2005 was the year the mapping world changed in many ways. It was the year of the first Where 2.0 summit (based on the Web 2.0 summit which started the year earlier in 2004). Google Maps was launched in February of 2005, Google Earth was first released in June 2005, and the web was abuzz with the first “Google Map Mashups” appearing as hackers like Paul Rademacher found ways to repurpose undocumented parts of the Google Maps API to make their own maps. 2005 was also the year that OpenStreetMap came online (after having started development in late 2004).
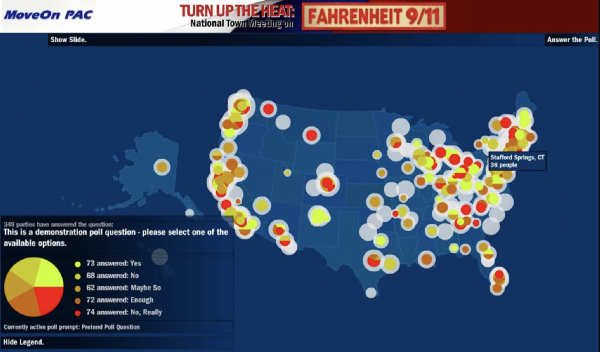
At Stamen, 2004–5 was when we first developed a working model that would come to define much of our output: the repurposing of code & assets used for client services work into open source / independent projects, and vise versa. We’d been doing increasing amounts of mapping work with MoveOn.org, and built a live web conferencing tool that let ten thousand people log on to hear Michael Moore, director of Fahrenheit 9/11, talk about how MoveOn could help. When you logged on to the site, you entered your zip code, and we bundled you up with others in your area into dots on a map. You could respond to live polls about what kinds of activities you were willing to engage in, the results would show up on the map, and MoveOn moderators would say things like “come on, Ohio, Illinois is pulling way ahead of you” and things like that.
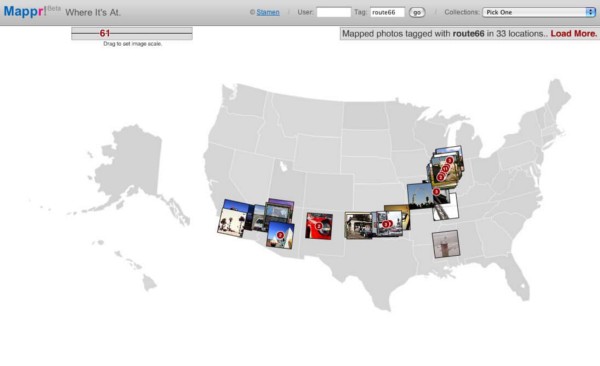
From there, we realized we could use this same code, which we developed to bundle people geographically, to bundle other data types. Flickr was taking the internet by storm, and Eric knew Caterina and Stewart, the founders. So we started inhaling Flickr images and predicting where they were taken by their tags, and called it Mappr. If your image was tagged “CA,” we’d have low, but some, confidence that the photo was taken in California (or Canada). If it was also tagged “San Francisco,” we’d have medium confidence that it was taken in that city. And if it were also tagged “94110,” then we’d have a high confidence that it was taken in the Mission, where Stamen is. We knew it was working when we discovered that images tagged “Route 66” drew a line outlining this famous highway, even though none of the photographers were aware of the others. We started sharing this at conferences like eTech & Where 2.0, MIT Technology Review wrote an article about it, and this is where people outside Eric’s circle first started learning about Stamen. OSM was very nascent at this time.
Tom Carden, Stamen alum 2006–2010, was one of the earliest contributors to OSM, even before he joined Stamen. He collaborated with OSM founder Steve Coast on (among other things) an early art print created as a fundraiser that uses GPS traces from a scooter delivery service to sketch out the streets of London. Tom brought a copy of this poster from London and gave it to Eric as a gift. It now hangs proudly in Stamen HQ:
‘There was a crescendo that was building the whole time to say like, “Okay, if and when this data is ready, we’re going to be poised to be the first people to use it for something important. To use it for something visually provocative or just utilitarian and everything in between.”’ — Tom Carden interviewed by Steve Coast in “The Book of OSM”.
From 2005 until about 2008, we started talking about the idea that Stamen’s mission was to increase literacy about mapping and data visualization, to help build the field (and the market). There was a lot of development of open source mapping tools (largely led by Michal Migurski & Shawn Allen) like ModestMaps in 2007 and Cascadenik in 2008, which explored the landscape of generating tiled maps with increasingly sophisticated styling. The ideas in these tools would later become incorporated in more widely-used libraries like Leaflet and CartoCSS.
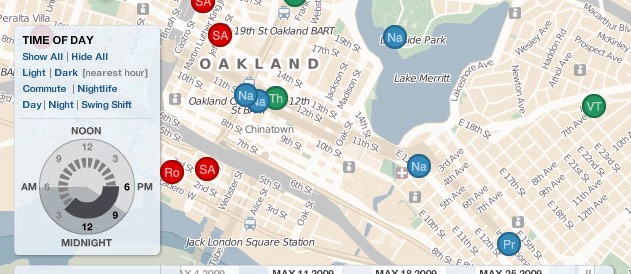
The mapping projects that Stamen built during this time, such as Crimespotting, used a variety of basemaps, from Bing Maps (which Stamen also designed, although using non-OSM data) to Cloudmade, and a few years later updated again to use Stamen’s in-house Toner style.
But while Stamen’s mapping attention was mostly focused elsewhere, OSM grew and grew and grew. In 2008, OSM’s blossoming was enough to catch Stamen’s eye again. After a few years as a useful provocation and passion project, the efforts of tens of thousands of volunteer contributors was starting to pay off, and OSM was now in a solid enough shape to use as the basis of serious map projects.
“Suddenly I care about OpenStreetMap, all over again.” — Mike Migurski, 2008

In 2009 came a flurry of Stamen projects made possible by the increasingly mature OSM database:
Cloudmade basemaps
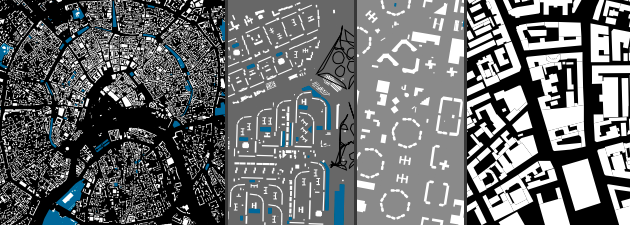
One of the first attempts by anyone to build a business on OSM was CloudMade, a company started by Nick Black and Steve Coast in 2007. Although they subsequently pivoted to a different business model, at the time CloudMade was offering a number of mapping APIs based on OSM data, and sponsored some early development on tools like Leaflet that are widely used today. We worked with CloudMade to design their basemap offerings, launched in 2009. More details about these basemaps can be found on Mike’s blog and in Stamen alum Geraldine Sarmiento’s portfolio. These three map styles called “Fresh”, “Pale Dawn”, and “Midnight Commander” were designed with different use cases in mind, but with particular attention to the ability of overlay data visualization on top of the map.
It’s hard to overstate the importance of these maps as precursors of what would come later. Although these maps didn’t last long, they felt like the first time we could see that basemaps could look like anything, and they could be made by anyone, not just the biggest corporations like Google and Microsoft.
“Maps From Scratch”
Also in 2009, Mike Migurski and Shawn Allen gave a workshop at the O’Reilly eTech conference called “Maps From Scratch”. One cool thing Mike and Shawn did was to leverage the brand-new (at the time) Amazon Web Services, creating a software “image” of an EC2 instance, basically a snapshot of a virtual computer that already had all the necessary OpenStreetMap data and open source software installed. Using EC2 in this way made it painless for workshop attendees to get started with the lessons without wasting most of the workshop downloading and installing software. While the website and tutorials they created are lost to the mists of time (there’s a snapshot at the Internet Archive), Mike and Shawn’s teaching materials went on to be one of the inspirations for Maptime which was founded by Beth Schechter at Stamen several years later.
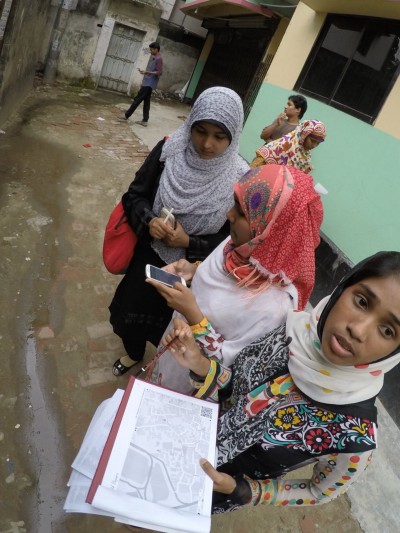
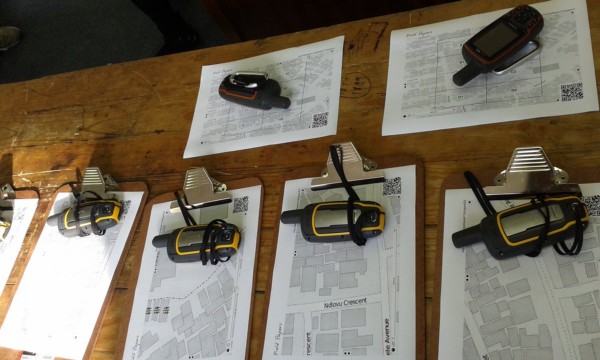
Walking Papers / Field Papers
2009 also saw the launch of Walking Papers (which would evolve into Field Papers a few years later) which started at the humanitarian mapping summit at Camp Roberts convened by John Crowley. We’ve talked about Walking Papers and Field Papers in many other venues, but the long and short of it is that Field Papers is a tool for printing out sections of the OSM map on simple pieces of paper, then hand-annotating those maps out in the field, and then taking a picture of your map and uploading it back to the Field Papers server where it can be traced back into OSM.
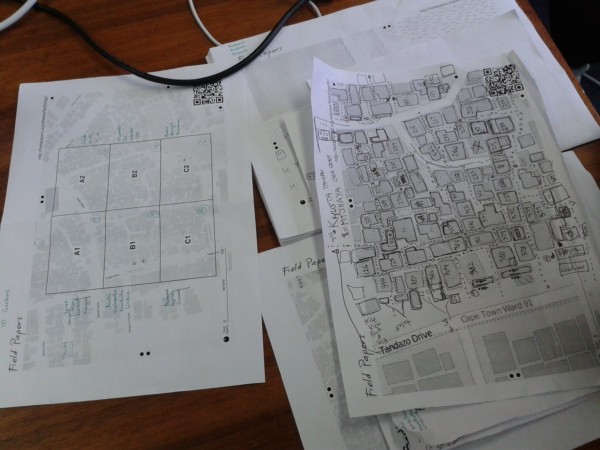
Field Papers has gone on to become an essential part of the OSM toolkit, and has also inspired many creative uses, leading to its inclusion as part of the “Hyperlinks: Architecture and Design” exhibition at the Art Institute of Chicago in 2011.
Mike’s presentation at State of the Map 2009 explains the creation of Walking Papers in depth:
In 2010 we were ready to push the limits of what we could do stylistically. Colorful, playful, high-contrast maps were the flavor du jour. Nothing was too glam in those days.
Nike Grid
In 2010 with Weiden+Kennedy, we launched Nike Grid to “turn London into a game board to get people running”. The project included an interactive website and printed maps displayed all over central London. We think this was our first use of OSM in a commercial application, which in itself was quite a learning experience. The initial launch of the map on Nike’s site didn’t include the requisite OSM attribution, and Eric remembers phone calls with members of the OSM Foundation to make sure we got the attribution right in the end.
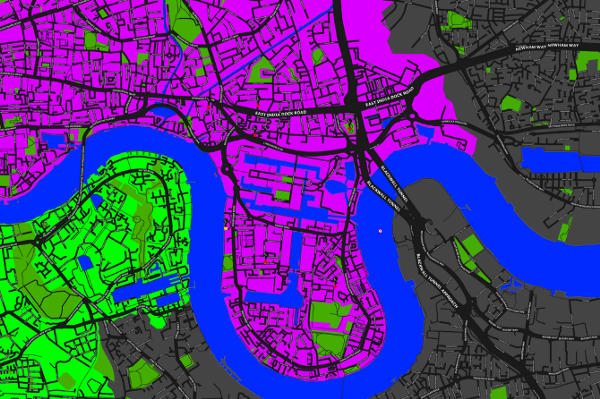
PrettyMaps
In 2010 we launched PrettyMaps, the brainchild of Aaron Straup Cope, which combines OSM data with polygons aggregated from geotagged Flickr photos. These gorgeous maps were included in the Talk To Me exhibition at MoMA along with Field Papers, and you can still buy prints on 20×200! All profits from sales on 20×200 were used to support the Humanitarian OpenStreetMap Team, which was founded in August 2010 and went on to become 501(c)3 non-profit and a critical part of the larger OpenStreetMap community.
CandyMaps
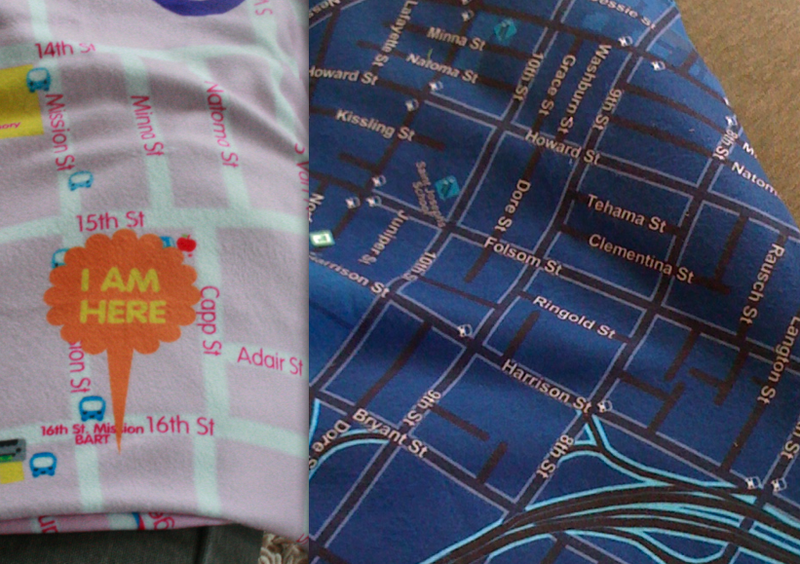
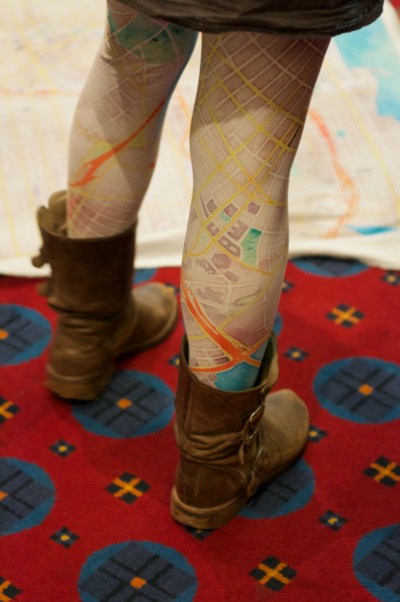
And if those maps weren’t enough for your sweet tooth, take a moment to admire 2010’s CandyMaps by Geraldine Sarmiento. This unabashedly playful map style was designed to be as friendly and fun as possible, and was created expressly for printing onto physical fabric products with personalized “you are here” markers, a business which would launch as “SoftCities” the following year:
SoftCities
In 2011 we launched SoftCities with Eric’s wife Nikki Gunn, offering OSM maps printed on blankets and leggings using the CandyMaps, Midnight Commander, and an early draft of our Watercolor style. These maps would be customized for the buyer’s chosen coordinates. As with the PrettyMaps prints, a portion of all proceeds from each SoftCities purchase was donated back to OpenStreetMap.
SoftCities became especially popular with OSM contributors who were “really looking forward to seeing their mapping ‘work’ in real life”.
“They’ve taken huge chunks of their time to contribute to OSM by filling in streets, restaurants, or obscure Northern England bridle trails, for instance.” In fact, she recently heard back from a customer who took his blanket for a walk on those very trails he himself inputted into OpenStreetMap. “He took pictures along the way and sent them to me. Crazy but lovely, right?” she says. “It’s great to feel like we’re giving something back to those who care so deeply about open data.” — Nikki Gunn Rodenbeck, in Fast Company
Map = yes
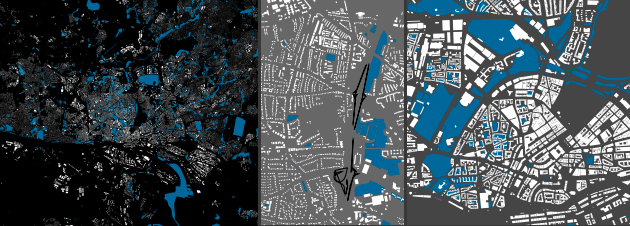
Also in 2011, we launched Map = yes. This was a collaboration with MapQuest Open, a branch of MapQuest exploring the possibility of a business based on OSM data, much like CloudMade. These stripped-down maps were mainly about illustrating how to build maps of any arbitrary style using OSM data from MapQuest’s API. The style is a tribute to the comics of Frank Miller — or was it a love song to Dave McKean’s “Cages”? (we are huge comics fans at Stamen) — and the name “map=yes” is an affectionate riff of the distinctive and sometimes peculiar tagging idioms in the OpenStreetMap world, resulting in attributes like “horse=yes”.
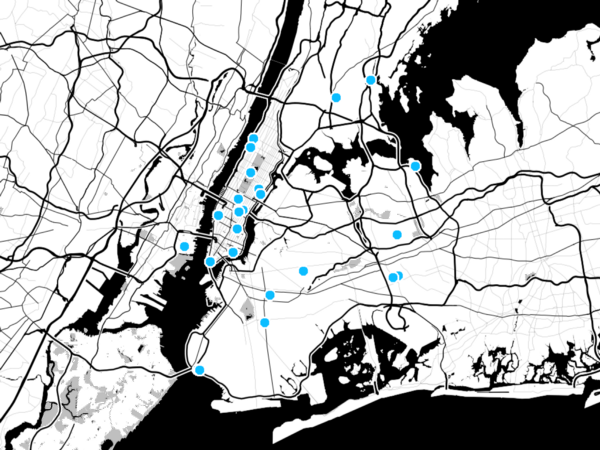
Citytracking
As part of a Knight Foundation grant we’d won in 2010, we started releasing more mapping tools based on OSM data with the goal of making it easier for journalists to create simple maps for their stories. Dotspotting was the first CityTracking project we produced, officially launched in 2011. Dotspotting launched with an early version of Toner, and the CityTracking project in general provided us the catalyst to move even further and faster with the development of our maps, and focus our OpenStreetMap basemap efforts into a more coherent vision. Everything that came afterward wouldn’t have been possible without that Knight News grant!
Now we’ve reached the end of part one, and it’s time to pause our story. “That was a lot of maps,” you must be thinking. “Surely there are no more maps left to be made!” Rest assured, there are a lot more maps to come. Many, many kinds of maps.

Stay tuned for our next installment, when the Stamen/OSM friendship hits the big time!