
We spend a lot of time thinking about the world parceled into meaningful units: political, cultural, physical — you name it and we probably have a system for saying what belongs and what doesn’t. And as cartographers at Stamen, we sometimes have access to data that lets us look at a region from a fresh perspective, showing these divisions in ways that actually make us feel more connected.
We learned recently that March 22nd has been designated “World Water Day” by the United Nations with the intention of bringing attention to global water insecurity. It seemed like a good day to highlight some work we’ve been doing with the World Wildlife Fund’s HydroRIVERS dataset, so here goes!
We’ve visualized a Blueprint for Global Water Security before, for the Nature Conservancy:
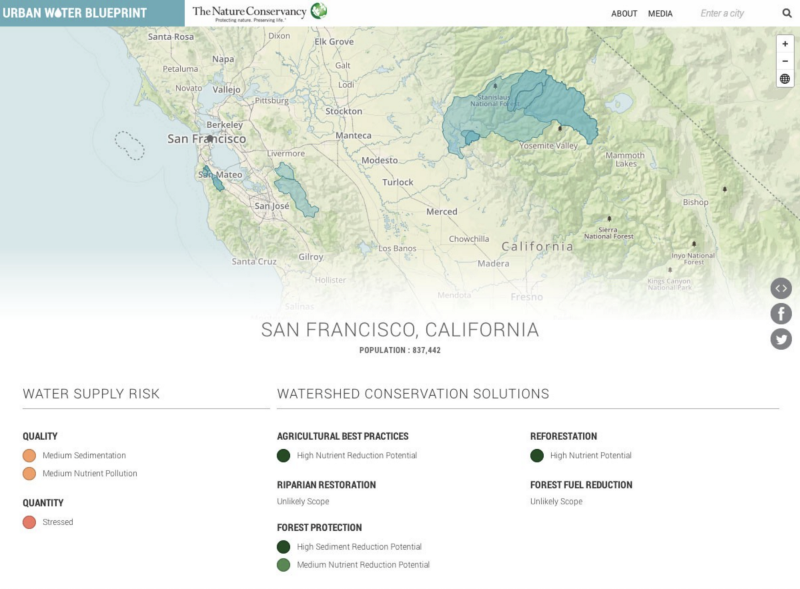
As informative as this set of maps (hopefully) are, they don’t really address how the water gets to where it’s ultimately going. So these new visualizations focus more on the flow and structure of the river than on their final destinations.
We’ve worked up several animations with this data throughout this post. In each animation, rivers animate starting at the most upstream location to where they empty into an ocean or inland basin. The river lines are colored by the total distance traveled, brightest have traveled furthest and darkest having traveled the least. Line widths are sized by the Strahler stream ordering system, which draws lines in a network with many connections quite thickly, and draws lines with few connections thinly. The maps visualize the distance of where the river begins to where it ends and everything it collects along the way.
All these maps are powered by CARTO’s excellent vector rendering library CARTO VL. We’re planning to publish a number of others throughout the week to help call attention to World Water Day a little longer, so if there’s a specific region or river you’d like us to pay attention to this week, drop us a line.
Monday we visualized North America, Asia & Oceania. Tuesday, we went to South America. Wednesday was Europe, Thursday we went to Africa…
Today, for our last set of maps we look at Siberia and the Arctic — projected of course!
As a bonus, we’ve added a couple of requests we got for: the Mekong River in Asia and the Columbia River in North America.
Arctic
Here we see the Canada’s longest river the Mackenzie flowing north, emptying in the Arctic Ocean and the Yukon River that starts in British Columbia, through Alaska, emptying in the Bering Sea:

Africa
Africa has 13 major river basins! The largest are the Congo, Nile, Niger, and Zambezi:
The Nile River is the world’s longest (although there are debates as to whether or not the Amazon River is longer!). The Nile has a mesmerizing northward flow draining into the Mediterranean Sea after passing through 11 countries:
Africa’s second longest river, and the world’s deepest, is the Congo with a very different flow starting in the northeastern headlands of Zambia taking a sharp turn northwest, then southwest draining into the Atlantic Ocean:
About 400 km off the coast of Africa is the biodiversity hotspot Madagascar where we see beautiful veins of water traveling throughout the island:
Europe
The HydroRIVERS region of Europe paints a stunning picture of how rivers flow in many directions. This region’s longest rivers empty into the Caspian Sea, the Black Sea, and the Persian Gulf:
The Volga is the longest river in Europe originating northwest of Moscow and discharging after a long journey into the Caspian Sea:
The second longest river in Europe is the Danube which originates in Germany flowing eastward through 10 countries all the way to the Black Sea:
South America
South America’s major watersheds lie east of the Andes mountains and major rivers flow to the Atlantic Ocean:
The world’s largest basin, in area, is the Amazon. Here we see how the Amazon River originates in the Andes Mountains, flows from west to east and takes a long meandering journey before emptying into the Atlantic Ocean:
South of the Amazon, is South America’s second longest river, the Paraná flowing south then east to empty into the Atlantic Ocean:
North America
Starting close to home, here are the major watersheds of North America. You can see that the Mississippi starts waaaay up along the Canadian border:
Focusing in on the Mississippi lets us see this even more clearly:
And the Colorado winds an even more distinctive north/south axis down to the Sea of Cortez:
The Columbia River basin:
Asia
Generally speaking, Asia’s major river systems are much more east-west oriented, with some notable exceptions in Laos & Pakistan:
Here’s the Yangtze, which meanders a bit:
The Ganges-Brahmaputra Basin shows up in a very different way than the others, with the two named branches of the river distinct from one another for a huge part of each ones’ length:
The Mekong River basin:
Oceania
Moving south we can see Australia’s & Papua New Guinea’s & Indonesia’s systems, all very different:
Here’s the Sepik River system in Papua New Guinea, with what looks like a long and convoluted journey through a mountain range:
Finally Australia, whose different kinds of climate from east to west show up dramatically in their varying different lengths & interconnectedness of river systems:
We’ll be here all week! Making maps of rivers around the world. So if you have a particular interest in (say) rivers in Madagascar, want to compare the Nile with the Bosphorus, here’s your chance to see them mapped by dropping us a note.