
Dataviz is clearly having a moment in the COVID-19 and social justice crisis — perhaps a definitive moment. Every time I turn around I see another chart, set of small multiples, dashboard. Some of them are great, some of them are just so-so, and some of them are actively dangerous, just like any other form of expression you’d care to name. The digital part of the medium is growing up, and I wanted to capture this moment, so here are a couple of callouts and thoughts.
Ben Schneiderman wrote about this moment in his Data Visualization’s Breakthrough Moment in the COVID-19 Crisis. I think it’s a great post and deserves to be widely read. He traces the history of the medium back 300 years to William Playfair’s book. Which sounds like a long time to be charting data, but I’d rather place our data visualization work firmly in the history of cartography and not just in that of charts. Not least because it lets me reference 27,000-year-old maps on mammoth tusks as historical antecedents for our work…it’s a broader set of references and I think that’s important. A map, after all, is just a data visualization with latitude and longitude in it.
I’ve been talking about the mainstreaming of dataviz publicly in one form or another since about 2014, when I gave a talk about it at EYEO. I’m sort of speaking out of two sides of my mouth here: On the one hand, I’m giving Ben a hard time for writing that dataviz is only 300 years old; and yet in this talk I’m claiming that the niche world of dataviz people that I came up with since the beginning of the Internet is the whole world, and that we need to get real and grow up. I can live with that.
The Data Visualization Society took off last year, and they’ve been putting out some great work. Notably, Elijah Meeks, writing before all this craziness took off, wrote “2019 Was the Year Data Hit the Mainstream” and made the point that for many people in this crazy new time, “The visualization is the data.” I’m still thinking about that. The Data Visualization Society released their Strategic Plan 2020: Data Visualization in the Mainstream. It’s the most comprehensive view of the field and the next five years that I know about. I’m proud to be on the Society’s Advisory Council with Giorgia Lupi (who keeps knocking it out of the park) and Alberto Cairo and others; they’re doing great work.
There was a bit of an inside-baseball spat where Paul Krugman at the New York Times used John Burn-Murdoch’s amazing work for the Financial Times in a tweet about how COVID case trajectories compare across countries. Which would normally be great, except that someone cropped out the credit and didn’t include John’s or the Financial Times’ info:
Which led to the Financial Times placing their logo in the graph itself, something I hadn’t seen much of before, but expect to see more of as this whole thing moves forwards.
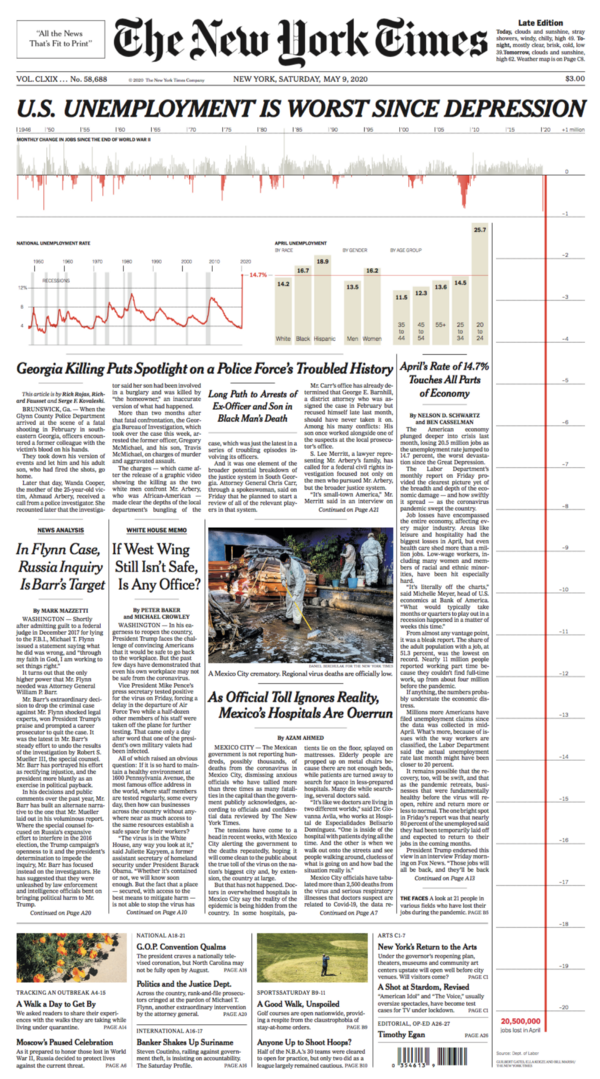
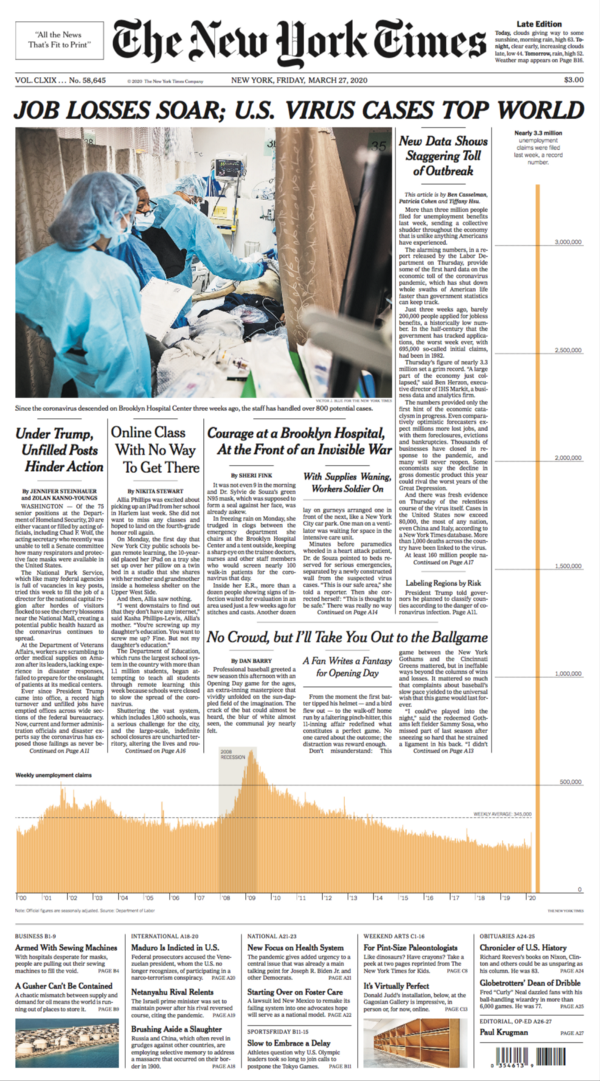
Perhaps there’s no clearer sign that dataviz has gone mainstream than the New York Times featuring it on their front page. In a significant shift from how they’ve previously done it, they’re breaking the containers that usually separate content from visuals from logos (as above) and using the full length of the page as a graphic element that communicates the enormity of the changes that are happening. On March 27, they drew your eyes down to a below-the-fold chart with a long line (who knows where this will go?). On May 9, a dataviz was the first element under the masthead, which is about as far “above the fold” as you can get, and you literally can’t see the bottom of it until you open up the paper.
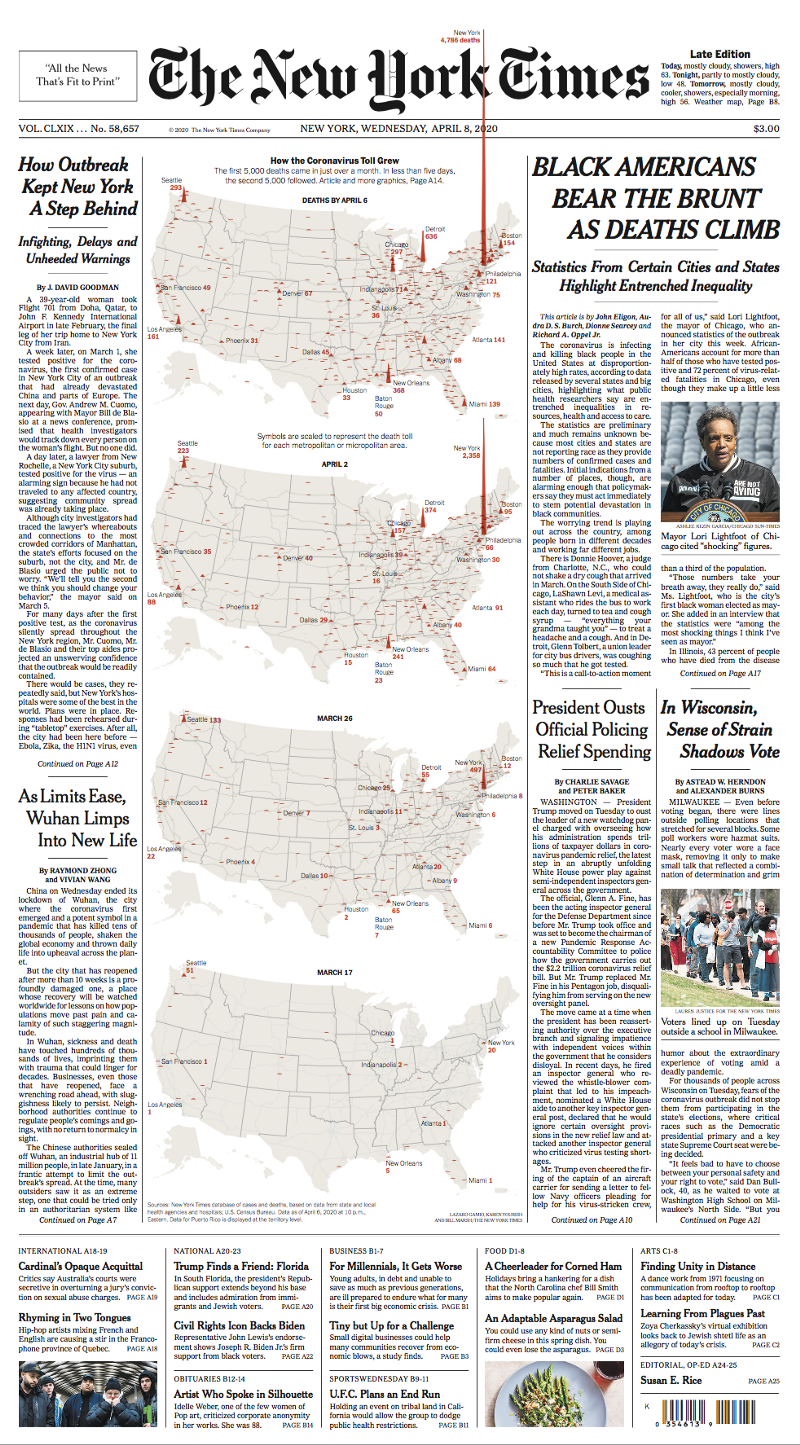
On April 8, they even broke the sanctity of the masthead to show how far off the charts cases in New York had climbed:
None of this is to make light of the suffering and death that are the sources of these extraordinary visuals, of course. But I do think that it’s worth marking the moment where the numbers are so out of bounds that they require new graphical language. We’re in a time of wild and spontaneous and terrifying developments, and I’m glad to see our graphic languages responding accordingly. I think we can learn from history here; people have broken graphic conventions before in the service of radical transformation.
What I’d also suggest is that this kind of graphic work, as deadly serious as the subject matter it depicts is, can be usefully described as a kind of play, and is worth looking at a little longer. I was lucky enough to study science fiction and the history of technology with Scott Bukatman, whose amazing Terminal Identity “puts to rest any lingering doubts of the significance of science fiction in contemporary cultural studies.” This work has been a touchstone for me since I read it, and was the inspiration for my college thesis on bodies & technology in World War 1.
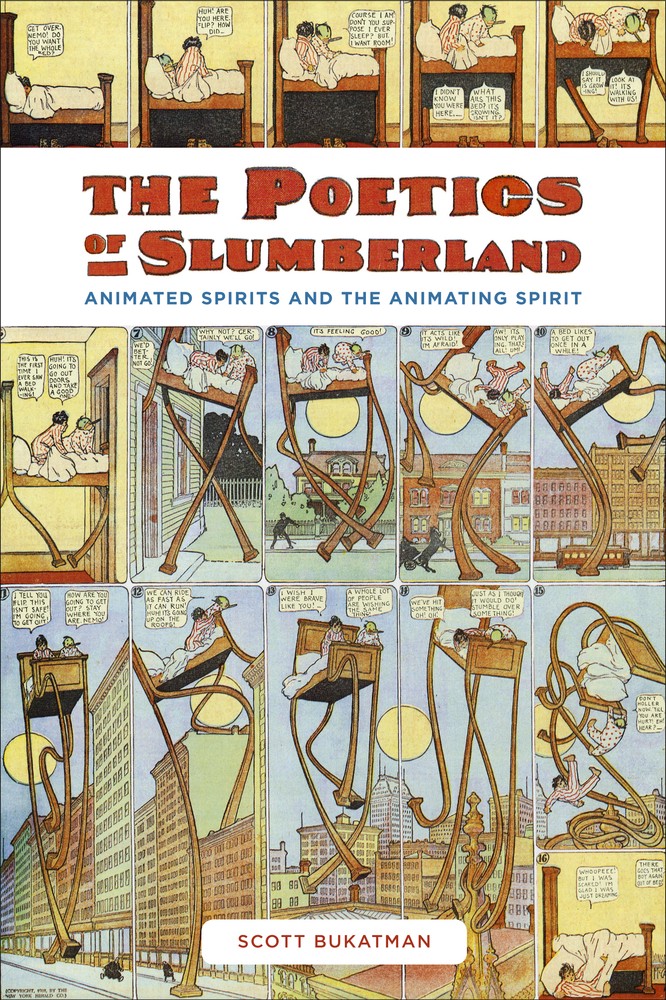
One of the good things about these sad days is I’ve got lots more time to read, and I’ve been spending some time with Scott’s new book, The Poetics of Slumberland: Animated Spirits and the Animating Spirit. The book is largely (but not at all entirely) about the work of Windsor McCay, whose groundbreaking Little Nemo in Slumberland took full advantage of the intertwined logic of comic panels on a page to stunning effect. What I love so much about Scott’s work is that he makes supposedly childish things like comics deeply meaningful as cultural markers for the times that they’re in, fully participating in the cultural currents that move through history, technology, and culture. The story he tells has references to early cinema (check out Gertie the Dinosaur, the first animated film to feature a dinosaur and in which the artist literally draws the character off the page), E.J. Marey & Eadward Muybridge (Scott demolished in a single paragraph my long-standing dismissal of the work of the latter as charlatanship), the history of American labor, Plasticman, I mean it’s just a treasure house (as was Terminal Identity). I don’t think there’d be a Stamen without my introduction to Scott’s work as a college student.
Scott references Johan Huinziga’s idea of Homo Ludens, his notion that “isolates play as a driving force of human culture, with implications for law, philosophy, the arts, myth, religion and the rest. His task is to rescue the concept of play from analyses that see it as a training ground for ‘real’ encounters. Such analyses ‘all start from the assumption that play must serve something than is not play, that it must have some kind of biological purpose. The emphasis on play’s positive functionalism was a reaction to Puritan attitudes toward play that saw it as useless, frivolous, perhaps even harmful, but the functionalist response turned play into something akin to work — and play is work’s ‘great complement and frequent competitor.’ For Huinziga ‘the fun of playing resists all analysis, all logical interpretation,’ and he proposes that we respect the unseriousness of play even as we recognize that ‘culture arises in the form of play.’
I like this quite a bit. There’s (a lot!) more to the book. It describes comic books like Little Nemo and Dream of the Rarebit Fiend by Windsor McKay (and Hogan’s Alley, and Plastic Man, and the Fantastic Four, and many many many others) as sites of play. And not just play for kids (whatever that means), but play in the sense of deep and serious engagement with their medium and the culture they participate in and reflect. Take a look at this Dream of the Rarebit Field from 1908(!), in which breaking the frame and playing with the relationships between ‘real’ space and graphic space is in some ways the whole point of the piece:
I think, when we think and talk about dataviz, it’s worth paying attention to the specifics of where and how we’re working. More Bukatman: “[Huinziga] does consider performance a kind of play: “The arena, the card-table, the magic circle, the temple, the stage, the screen, the tennis court, the court of justice, etc. are all in form and function play-grounds, i.e. forbidden spots, isolated, hedged round, hallowed, within which special rules obtain. All are temporary worlds within the ordinary world, dedicated to the performance of an act apart.” I think it’s interesting that “screen” is listed (along with the court of justice!) here. Dataviz as we know it usually (but certainly not always) takes place on a screen of some kind, but almost always within some kind of proscribed space where special rules obtain. And if we think of our screens (and pages) as literally play-grounds, temporary worlds, then play within those grounds becomes not only serious, but necessary for the practice of dataviz.
The Times also made a remarkable decision to move past this kind of dataviz work on their front page to mark 100,000 American deaths by taking over the whole front page with a list of (some of) the dead, and by posting a truly heartbreaking endlessly scrolling list of the names of American deaths due to COVID-19. It’s just horrible, there’s no way to take it in. I think you could make a case that this work deserves to be talked about alongside the American Vietnam War Memorial in DC, the Mémorial des Martyrs de la Déportation in Paris, and the National Memorial for Peace and Justice in Montgomery.
Sometimes you have to just list all the fucking names.