
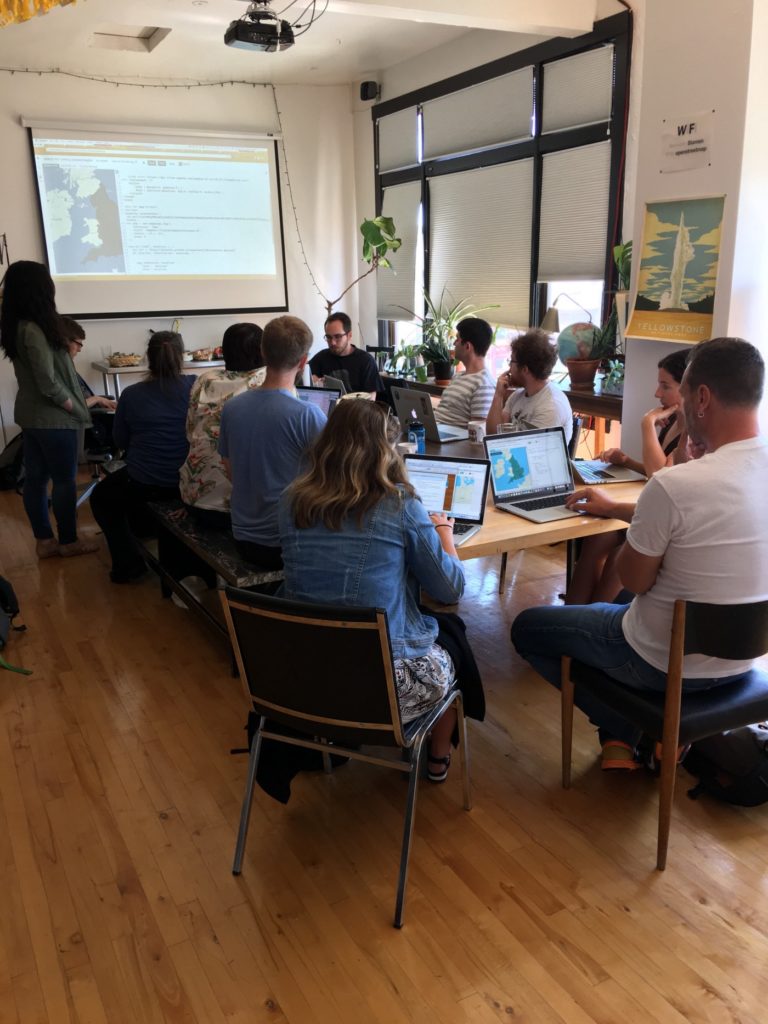
Late this summer, 10 people gathered at Stamen Design’s studios to learn how to design and work with geospatial data on the web.
What we set out to do
We all set aside 4 hours of a Sunday afternoon to get a hands-on introduction to the leading tools for web based mapping visualization. With a repo full of workshop materials, we dove into GeoJSON, Leaflet, MapboxGL and d3.js. From the start it was clear we wouldn’t be able to cover all of the exciting examples we had collected, so our main focus was giving a solid foundation for exploring the rich world of online web-mapping and data visualization.
What went right
well organized material in a relaxed setting
There are two positive things that stood out in the feedback we heard from the students, and they go hand in hand. The first was that we connected the dots for them in terms of how all of these tools and techniques fit together. With so many d3.js examples out there in the wild, it can be overwhelming trying to find a starting point
The second thing people liked was learning by doing. It’s one thing to be introduced to new and confusing concepts like map projections and GeoJSON its another thing to get your hands dirty and start feeling for yourself how they work.
What could have been better
Something we heard from several students is that they wanted more time. We take that as a compliment, if people are asking for more instead of running away screaming we must be doing something right! This may be related to something else that was brought up, we tried to cover too much. We love this subject matter and want to share as much as we can, but we need to make the best of the limited time we have together to set people up for success. Our goal is to get the content just right so you have enough to work with when you get home (or back to work) and continue building your knowledge.
We heard several people loud and clear, you want more hands on. It’s a tough balance introducing new concepts and making time to play with them. We tried to prepare many examples that could be explored after class beyond the few we went through together. Next time we will make sure to make more space for hands on activities.
Designing with Spatial Data
What we set out to do
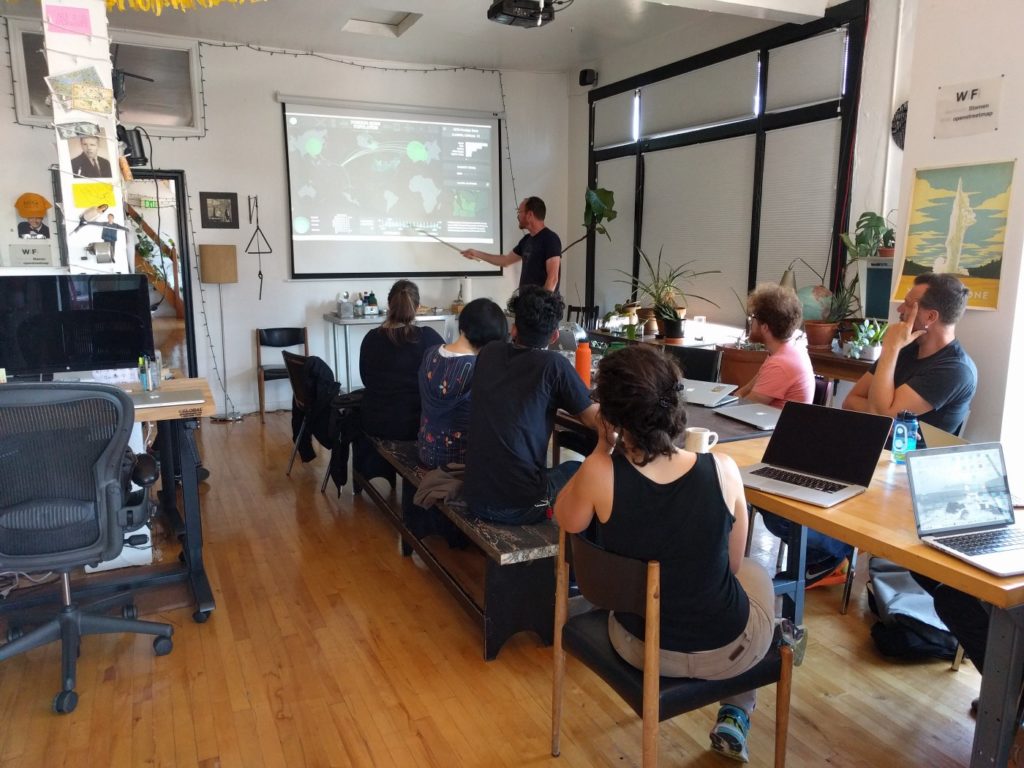
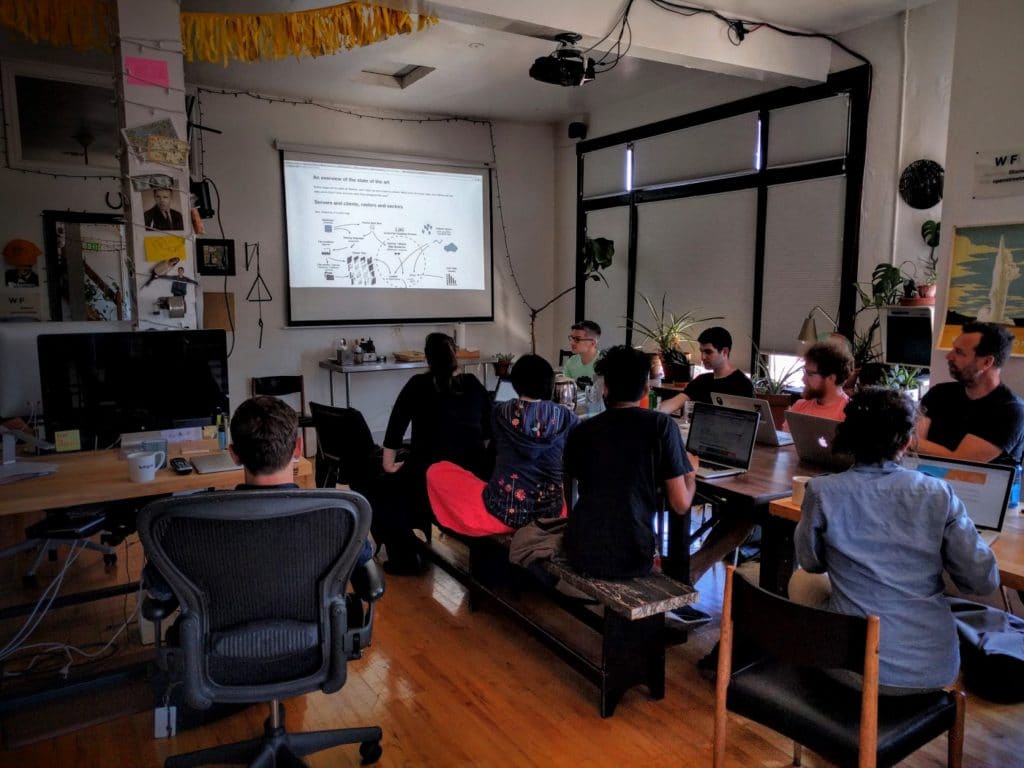
Stamen has been making the best damn maps and data visualizations for years. The results coming out of the studio might seem like magic but we wanted to shed some light on what is actually a very interdisciplinary exploration. Eric kicked off the day with an overview of Stamen’s design process, giving a behind the scenes look at how they think about data and design.
There is a lot to think about when it comes to making maps, from colors and accessibility to geopolitical boundaries it can be intimidating to start designing from scratch. One of our main goals was providing context for the tools and resources available to design with. Alan took us through a thorough survey of mapmaking design principles and technologies, with interactive examples along the way.
What went right
Very informative, a good primer to the complicated world of data vis on maps
It turned out people were really interested in Stamen’s design process. it can be mystifying how such beautiful output starts from raw numbers, where does one begin? how does one find their way? how do you start such a process inside an existing organization? We spent a good amount of time discussing these questions and more at the end of the workshop.
People were also very happy with the context we provided, they let us know we helped put various puzzle pieces into place for them.
What could have been better
We heard again that people wanted even more hands-on material. This is something we will definitely focus on in our next set of workshops.
Something we didn’t expect but learned could be better was the order of the 2 workshops. Next time we will put this class first. We originally thought we’d give people the technical building blocks first and then show them how we reason about them. It seems like it might be more effective to give people more context & overview before we dive in to solving problems with tools. People seemed to enjoy both classes but we hope to make them even more effective by doing things in the right order.
Lets do it again!
Stamen is hosting the second round of classes November! We are really looking forward to trying out some improvements and doubling down on what went well.